user@devops:~$ cat README.md
IRQ Watch
# Description
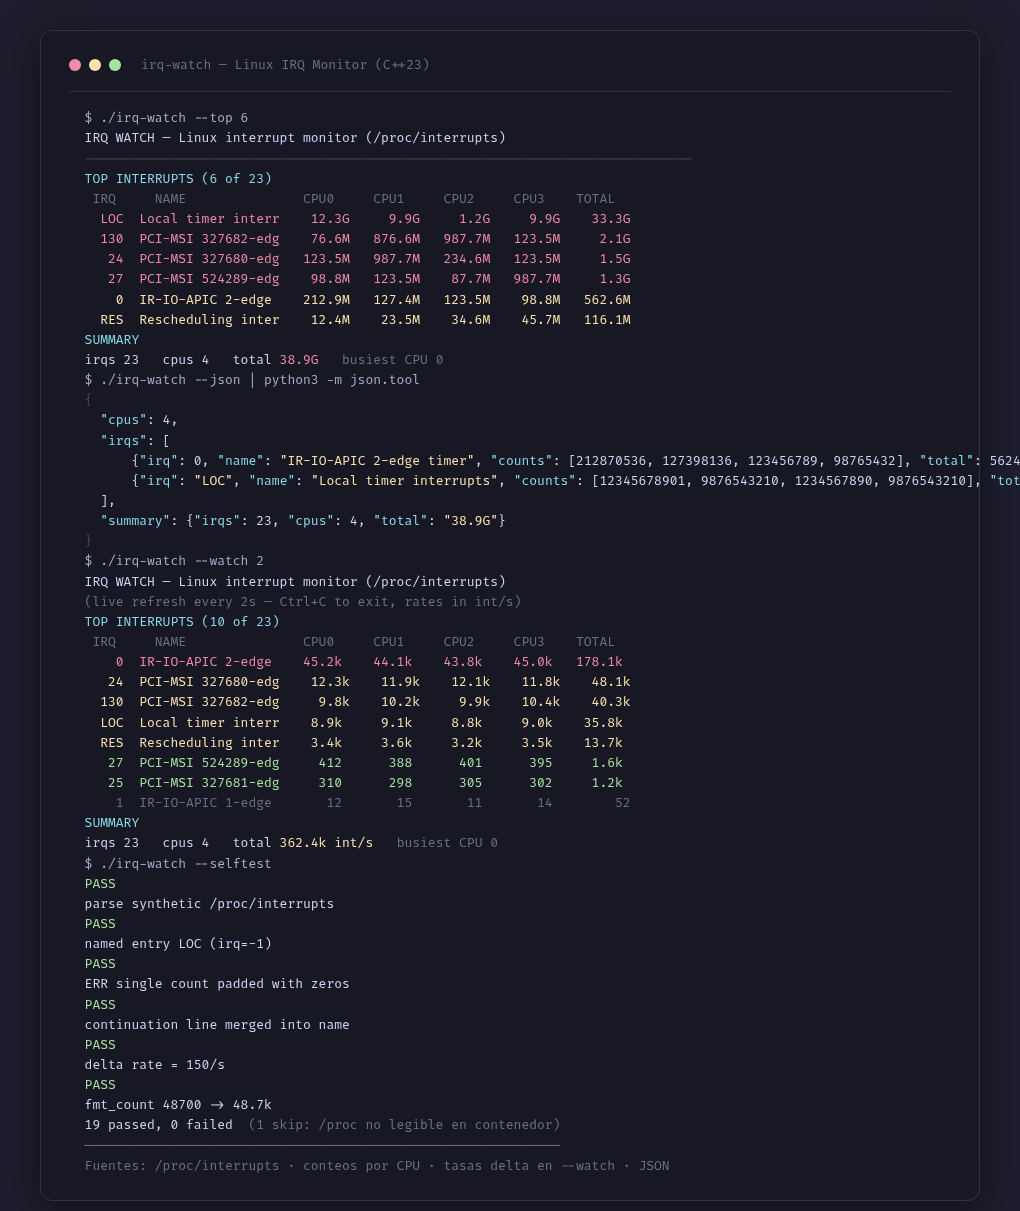
IRQ Watch (cpp-irq-watch) is a Linux kernel interrupt monitor written in C++23 that reads /proc/interrupts and shows the interrupt distribution per CPU core. Robust parsing: CPU header, IRQ rows with per-core counts, named entries (NMI, LOC, RES, ...), single-count entries (ERR, MIS — zero-padded) and multi-line continuation rows (lines that wrap on machines with many CPUs). Top-N table by activity (--top N) with per-CPU and total columns, 18-char truncated names and aligned columns; activity color traffic light: green <500 int/s, yellow <5000, red >=5000 (dim = idle), and in snapshot mode by total magnitude (<10M green, <1G yellow, >=1G red). Live watch mode every N seconds (--watch N) with delta rates (interrupts per second per IRQ and per CPU), screen clear and flush (complete output even under timeout/kill). Demo mode (--demo) with an embedded synthetic sample whose counters grow via an LCG — lets you see the tool on containers/VMs where /proc/interrupts is empty or masked. Full JSON output (--json) with {cpus, irqs[{irq,name,counts,total|rate}], summary{irqs,cpus,total,total_rate}} and readable number formatting (12.3k, 987.7M, 1.2G). 19 self-verification tests (--selftest): synthetic parsing (header, named, ERR/MIS, continuations), deltas, formatting and a conditional smoke test against real /proc. Zero dependencies: direct build with g++ -std=c++23.
# Key features
$ Robust /proc/interrupts parsing: CPU header, IRQ rows with per-core counts, named entries (NMI, LOC, RES) and single-count entries (ERR, MIS)
$ Multi-line continuation rows: wrapped rows on machines with many CPUs are completed and merged into the device name
$ Top-N table by activity (--top N) with per-CPU and total columns; 18-char truncated names with aligned columns
$ Color traffic light: green <500 int/s, yellow <5000, red >=5000 (dim = idle); in snapshot mode by total magnitude (<10M green, <1G yellow, >=1G red)
$ Live watch mode every N seconds (--watch N) with delta rates: interrupts per second per IRQ and per CPU, with screen clear and flush
$ Demo mode (--demo) with an embedded synthetic sample and LCG-growing counters for containers/VMs where /proc/interrupts is empty or masked
$ Full JSON output for scripting (--json): cpus, irqs[{irq,name,counts,total|rate}] and summary with total and total_rate
$ 19 self-verification tests (--selftest): synthetic header/named/ERR-MIS/continuation parsing, deltas, formatting and conditional smoke test against real /proc
# Gallery
# Technologies used