user@devops:~$ cat README.md
Sched Watch
# Description
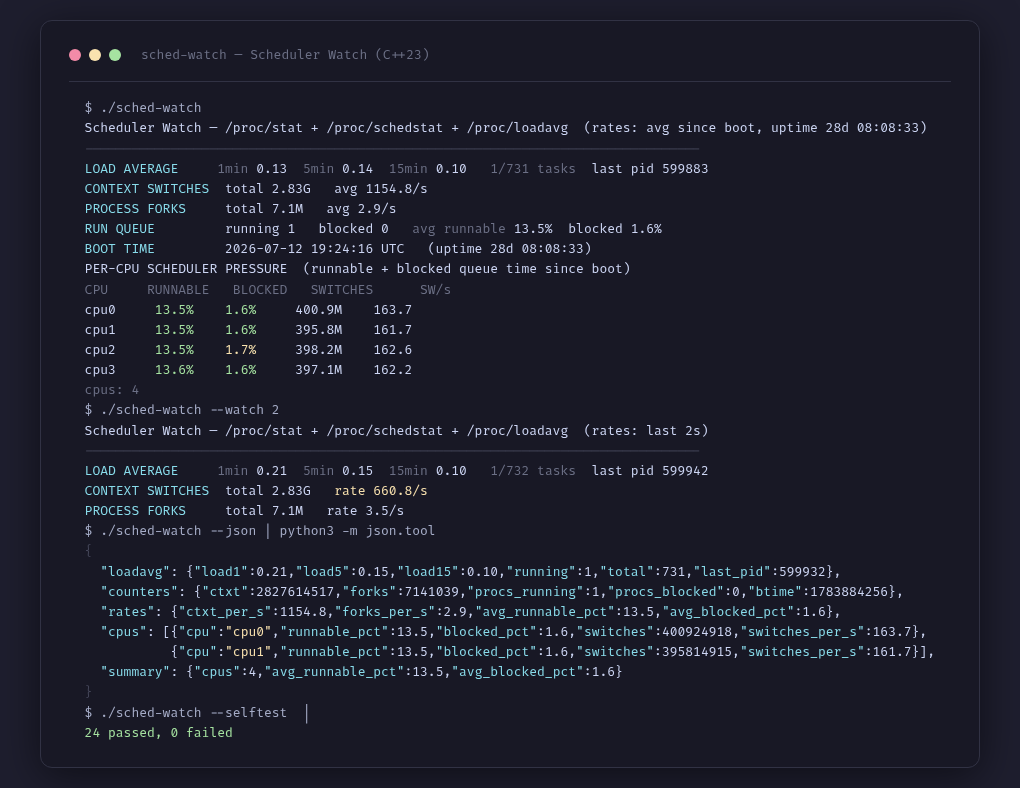
Sched Watch (cpp-sched-watch) is a Linux scheduler monitor written in C++23 that reads /proc/stat, /proc/schedstat, /proc/loadavg and /proc/uptime to show real scheduler pressure: 1/5/15-min load averages, running/total tasks and last PID, total context switches (ctxt) with average rate, process forks, run queue (procs_running/procs_blocked), boot time and, per CPU, the percentage of time with runnable/blocked tasks queued since boot (runnable_ns/blocked_ns from /proc/schedstat) plus switches per core. It includes a watch mode with live delta rates every N seconds (--watch N: ctxt/s and forks/s), full JSON output for scripting (--json) with {loadavg, counters, rates, cpus[], summary} structure, pressure filtering with --top N, optional ANSI colors (--no-color) and 24 self-verification tests (--selftest) covering real /proc/stat + /proc/schedstat parsing, metric derivation and JSON structure. Zero dependencies: direct build with g++ -std=c++23.
# Key features
$ Per-CPU scheduler pressure from /proc/schedstat: % runnable/blocked queue time since boot and switches per core
$ 1/5/15-min load averages + running/total tasks and last PID (/proc/loadavg)
$ Global counters from /proc/stat: context switches (ctxt), forks (processes), procs_running/blocked and boot time
$ Watch mode with live delta rates every N seconds (--watch N): ctxt/s and forks/s with on-screen refresh
$ Full JSON output for scripting: loadavg, counters, rates, cpus[] and summary
$ Pressure filtering with --top N and optional ANSI colors (--no-color)
$ 24 self-verification tests: real /proc/stat + /proc/schedstat parsing, metric derivation and JSON structural validation (--selftest)
# Gallery
# Technologies used