user@devops:~$ cat README.md
Slab Watch
# Description
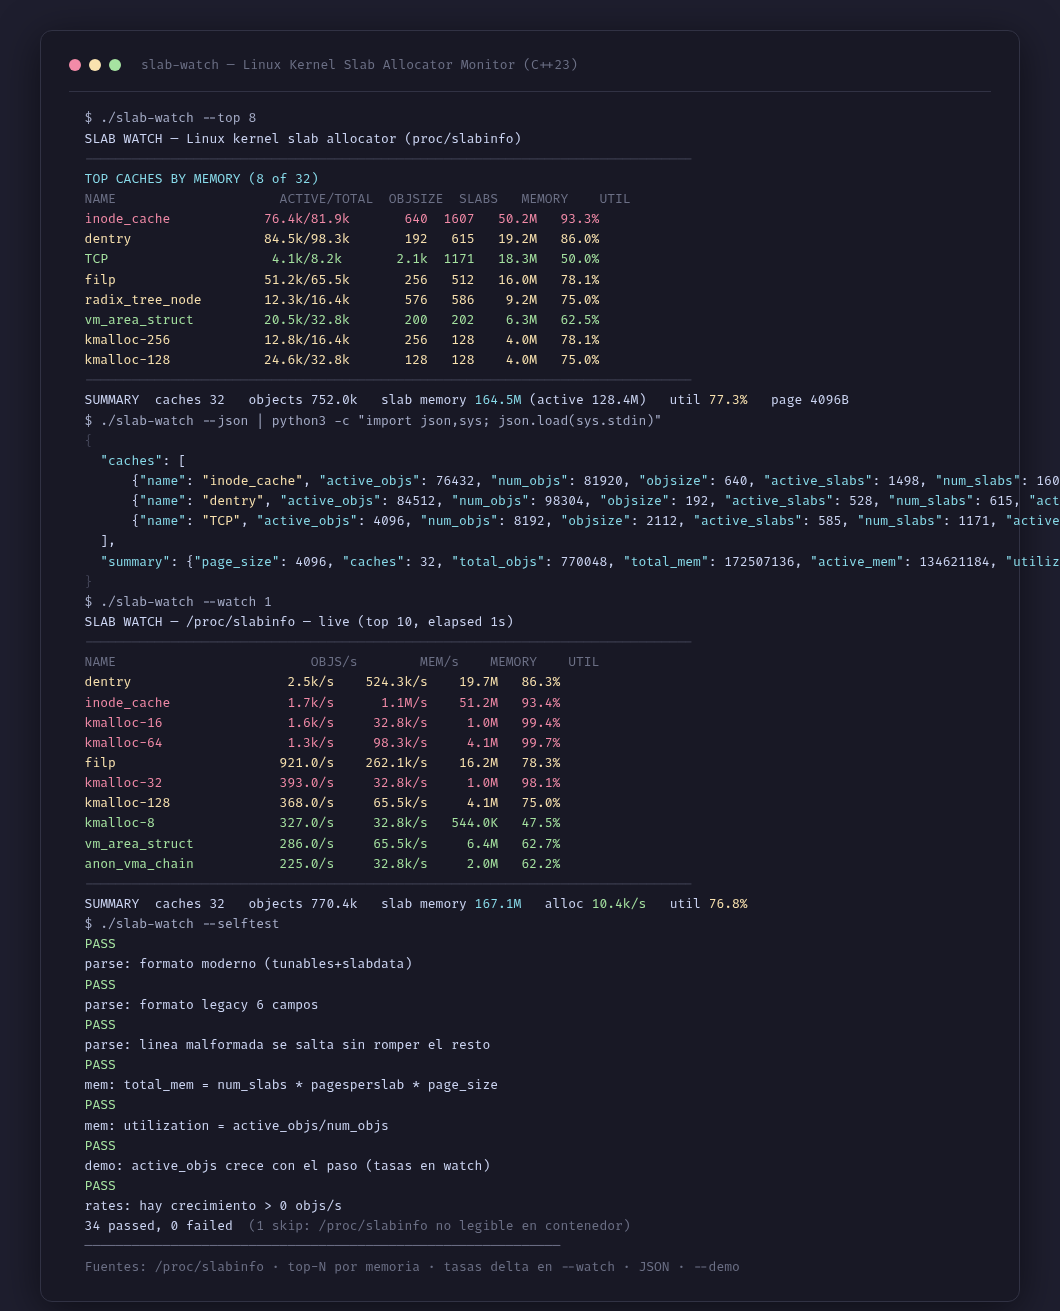
Slab Watch (cpp-slab-watch) is a Linux kernel slab allocator monitor written in C++23 that reads /proc/slabinfo and shows the state of the kernel's object caches. Robust parsing: version banner, # header lines, modern format with : tunables and : slabdata sections, legacy 6-field format (older kernels without slabdata) and malformed lines that are skipped without breaking the rest. Per-cache memory math: num_slabs x pagesperslab x page_size (total) and active_slabs x pagesperslab x page_size (active), using the real sysconf(_SC_PAGESIZE). Top-N table by memory (--top N) with name truncated to 20 chars, active/total objects, objsize, slabs, memory and utilization; color traffic light: green <=70%, yellow <=90%, red >90% (dim = inactive), with --no-color for pipes/logs. Live watch mode every N seconds (--watch N) with delta rates (objects/s and bytes/s per cache), elapsed time, screen clear and flush (full output even with timeout/kill). Demo mode (--demo) with an embedded synthetic sample of 32 realistic caches (kmalloc-*, dentry, filp, inode_cache, TCP, ...) with growing counters — lets you see the tool in containers/VMs where /proc/slabinfo is masked. Full JSON output (--json) with {caches[{name, active_objs, num_objs, objsize, objperslab, pagesperslab, active_slabs, num_slabs, active_mem, total_mem, utilization}], summary{page_size, caches, total_objs, active_objs, total_mem, active_mem, utilization}} and human-readable number format (12.3k, 987.7M, 1.2G). 34 self-test checks (--selftest): synthetic parsing (modern, legacy, malformed, empty), memory math, aggregation, formatting, rates and a conditional smoke test against the real /proc. Zero dependencies: direct compilation with g++ -std=c++23.
# Key features
$ Robust /proc/slabinfo parsing: version banner, # header, modern format with tunables/slabdata sections and legacy 6-field format
$ Malformed or non-numeric lines are skipped without breaking the rest of the parse
$ Per-cache memory math: num_slabs x pagesperslab x page_size (total) and active_slabs x pagesperslab x page_size (active), using the real sysconf page size
$ Top-N table by memory (--top N): name truncated to 20 chars, active/total objects, objsize, slabs, memory and utilization
$ Color traffic light by utilization: green <=70%, yellow <=90%, red >90% (--no-color disables ANSI)
$ Live watch mode every N seconds (--watch N) with delta rates: objects/s and bytes/s per cache, elapsed time, screen clear and flush
$ Demo mode (--demo) with an embedded synthetic sample of 32 realistic caches (kmalloc-*, dentry, filp, inode_cache, TCP) with growing counters for containers/VMs
$ Full JSON output for scripting (--json) and 34 self-test checks (--selftest) with conditional smoke test against the real /proc
# Gallery
# Technologies used