GridGauge
 Source code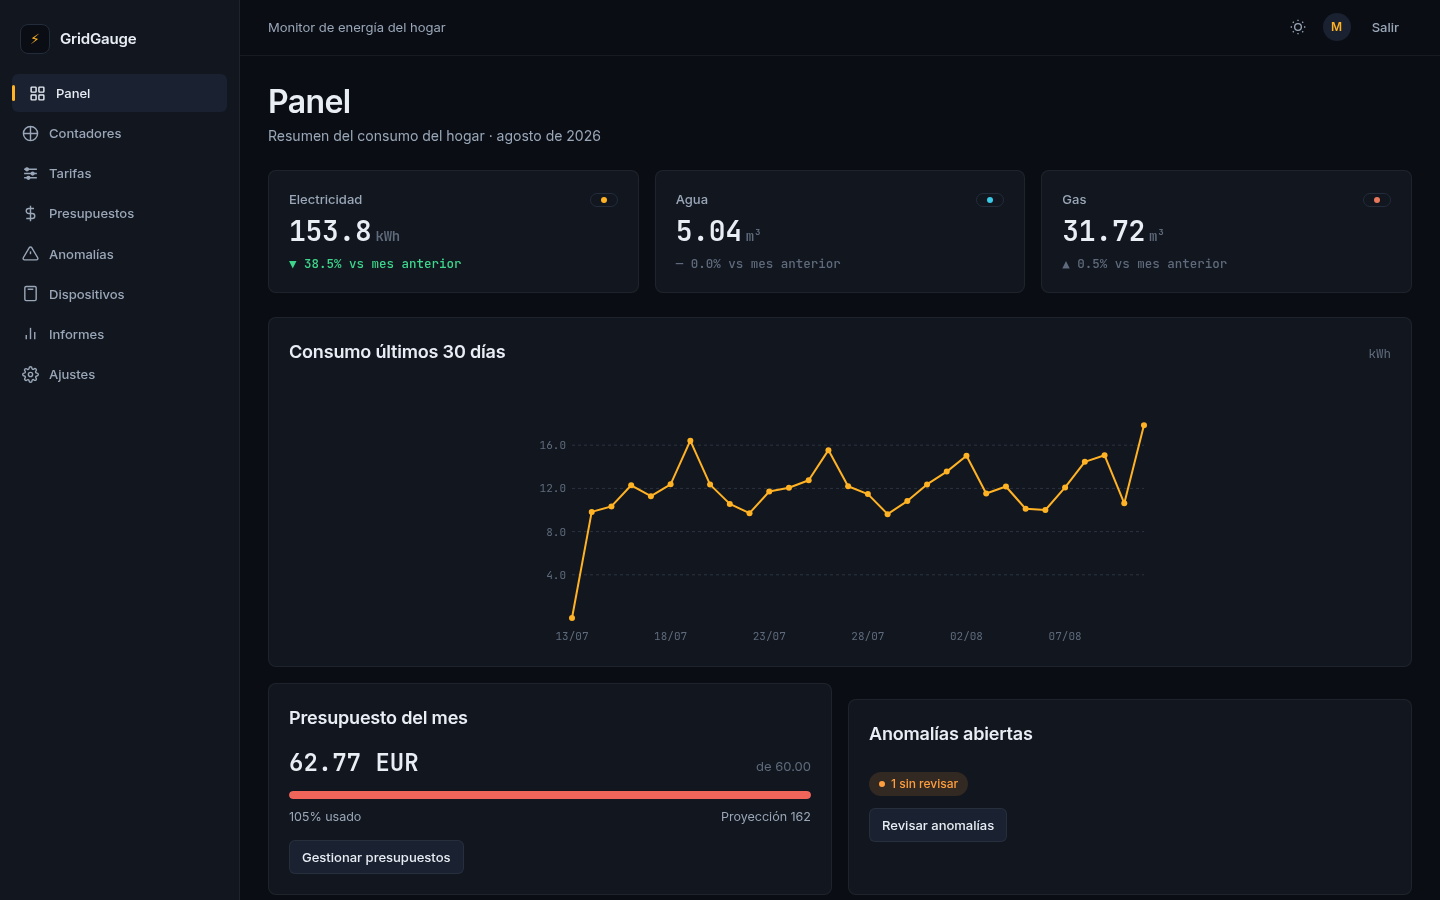
Key features
Automatic anomaly detection: >2.5σ spike, sustained high, no data ≥48h and night leak, with severity and resolve flow
Tariffs with progressive tiers (JSONB) and peak/off-peak windows that cross midnight
Time series by day/week/month/year with zero-filled gaps and previous-period comparison
Monthly budgets with % used, deviation projection and on_track/at_risk/exceeded status
Batch CSV import (max 500 rows) and report export with BOM
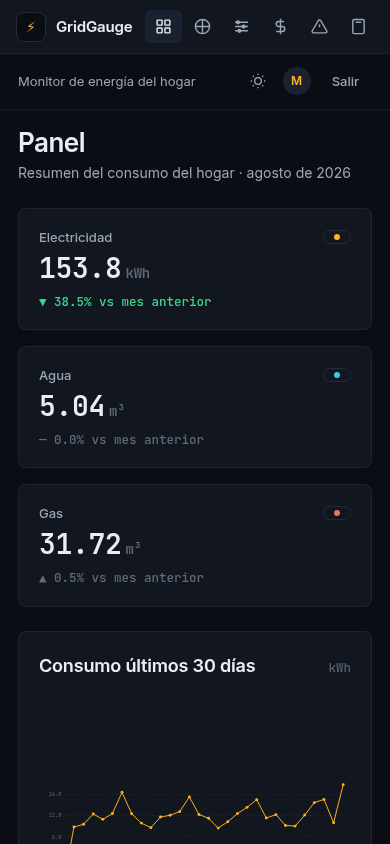
KPI dashboard with custom SVG charts (line, bar, donut, gauge) — no external libraries
Email login, persistent JWT, per-user scoping
Description
Turns meter readings (electricity kWh, water m³, gas m³) into real cost, bill projections, anomaly alerts and monthly budgets. Meter CRUD with assigned tariff, manual readings per period with duplicate rejection, batch CSV import (max 500 rows), tariffs with unit price, fixed fee, progressive tiers (JSONB) and peak/off-peak windows that cross midnight, KPI dashboard with today/month consumption per utility and budget progress, time series by day/week/month/year, automatic anomaly detection (>2.5σ spike, sustained high 3 days ≥2σ, no data ≥48h, night-window leak 02:00-05:00) with info/warning/critical severity and resolve/dismiss, budgets with on_track/at_risk/exceeded status, devices with estimated share per meter, monthly reports with YoY comparison, estimated CO₂ (configurable factors) and CSV export. Dark responsive "Volt & Ash" UI (electric amber, water cyan, gas terracotta) with light mode. Email login, persistent JWT. Angular 22 + NestJS 11 + SQLite.
Technologies used
 Angular
  TypeScript
  NestJS
  SQLite