user@devops:~$ cat README.md
Anomaly Detection — 3 Methods
# Description
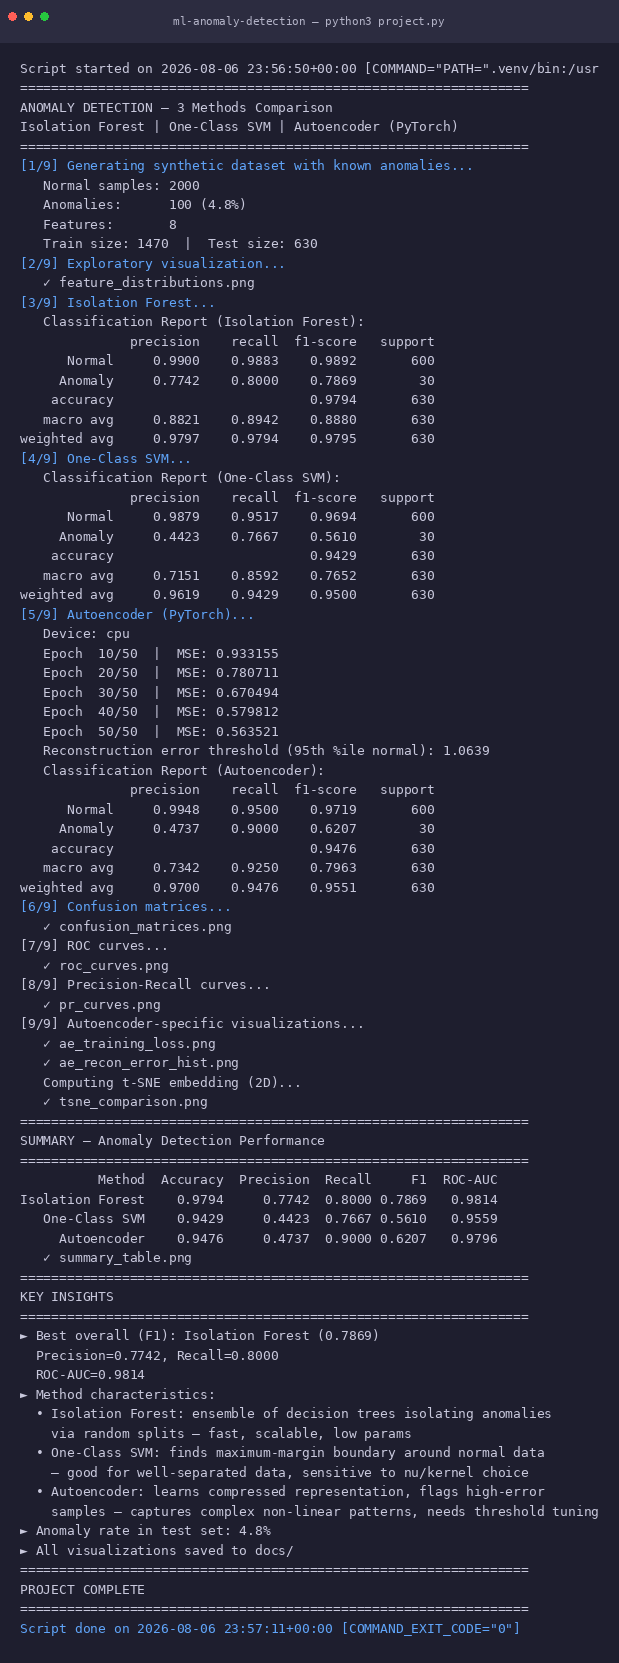
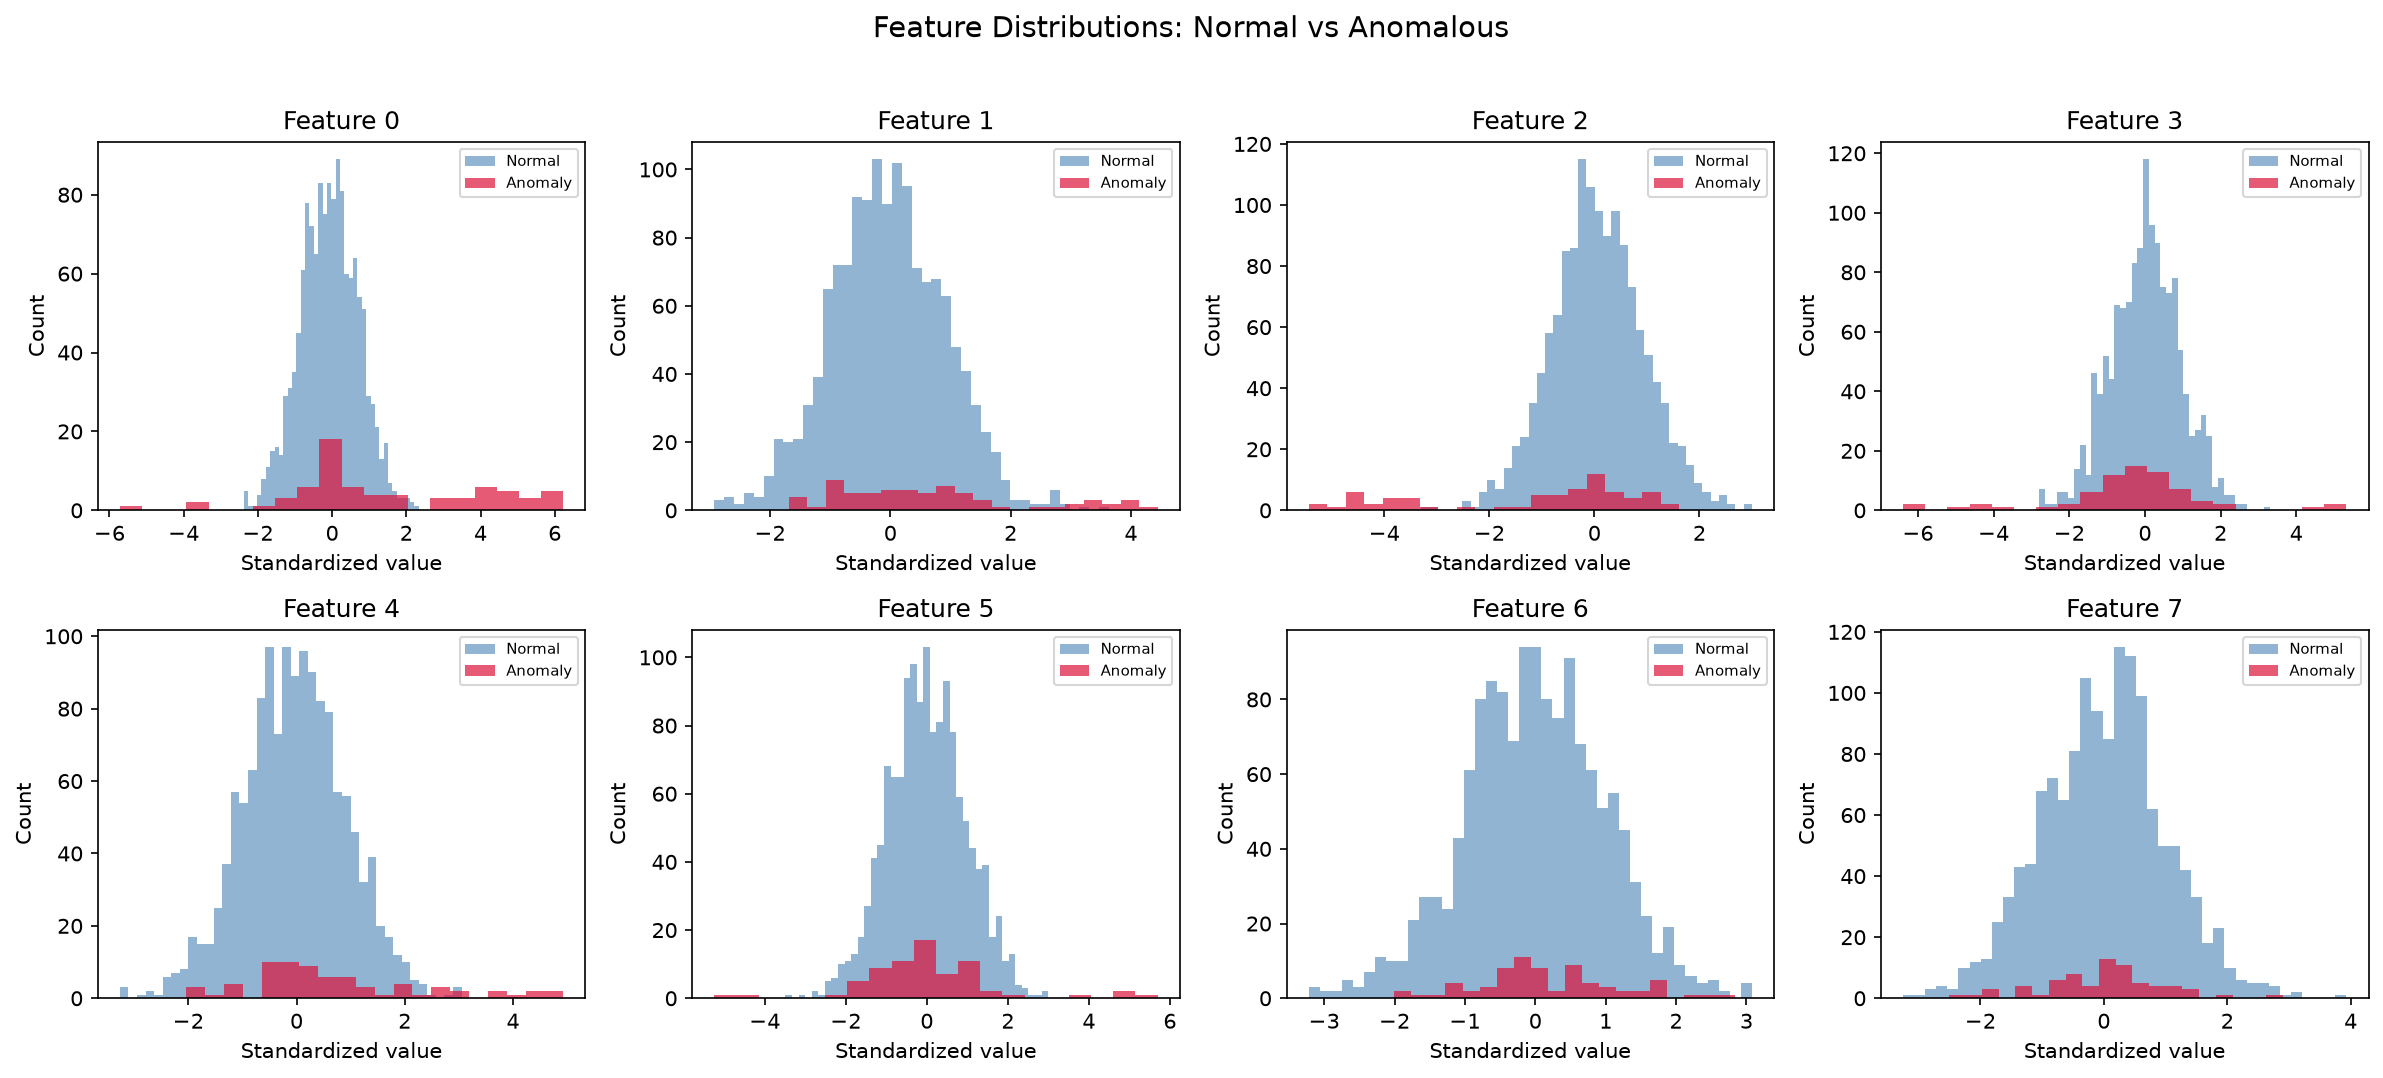
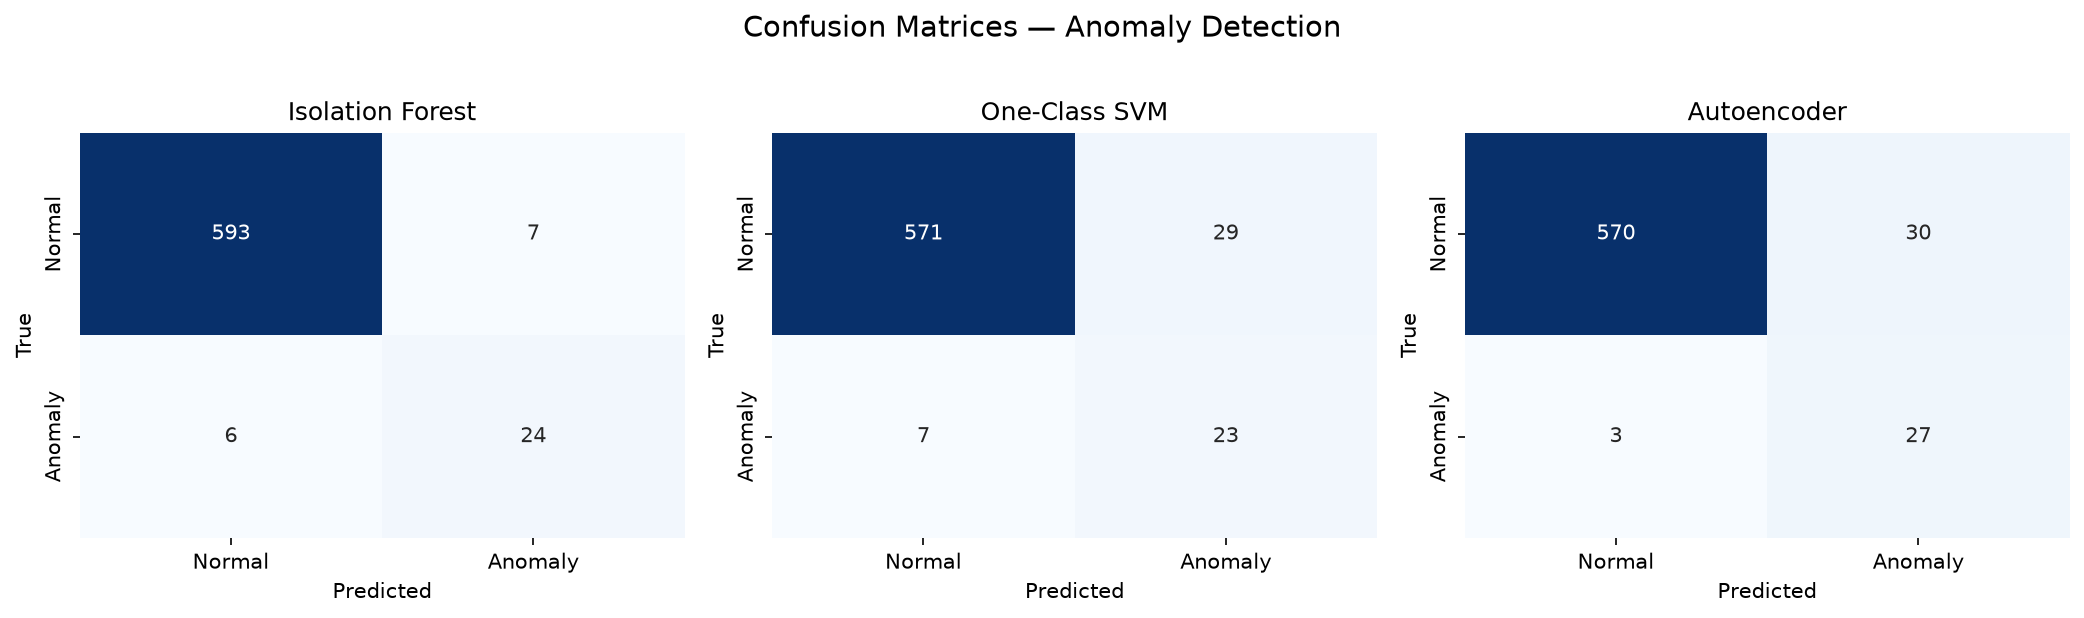
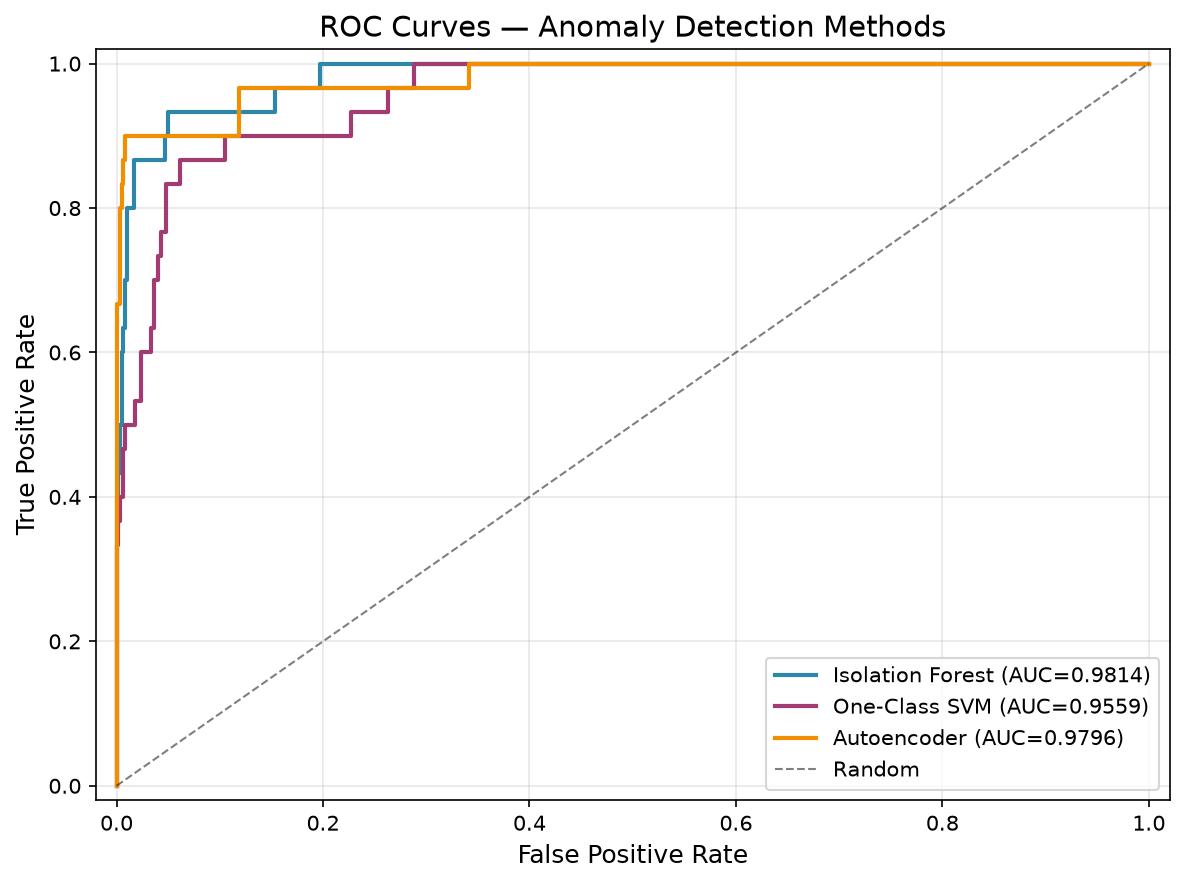
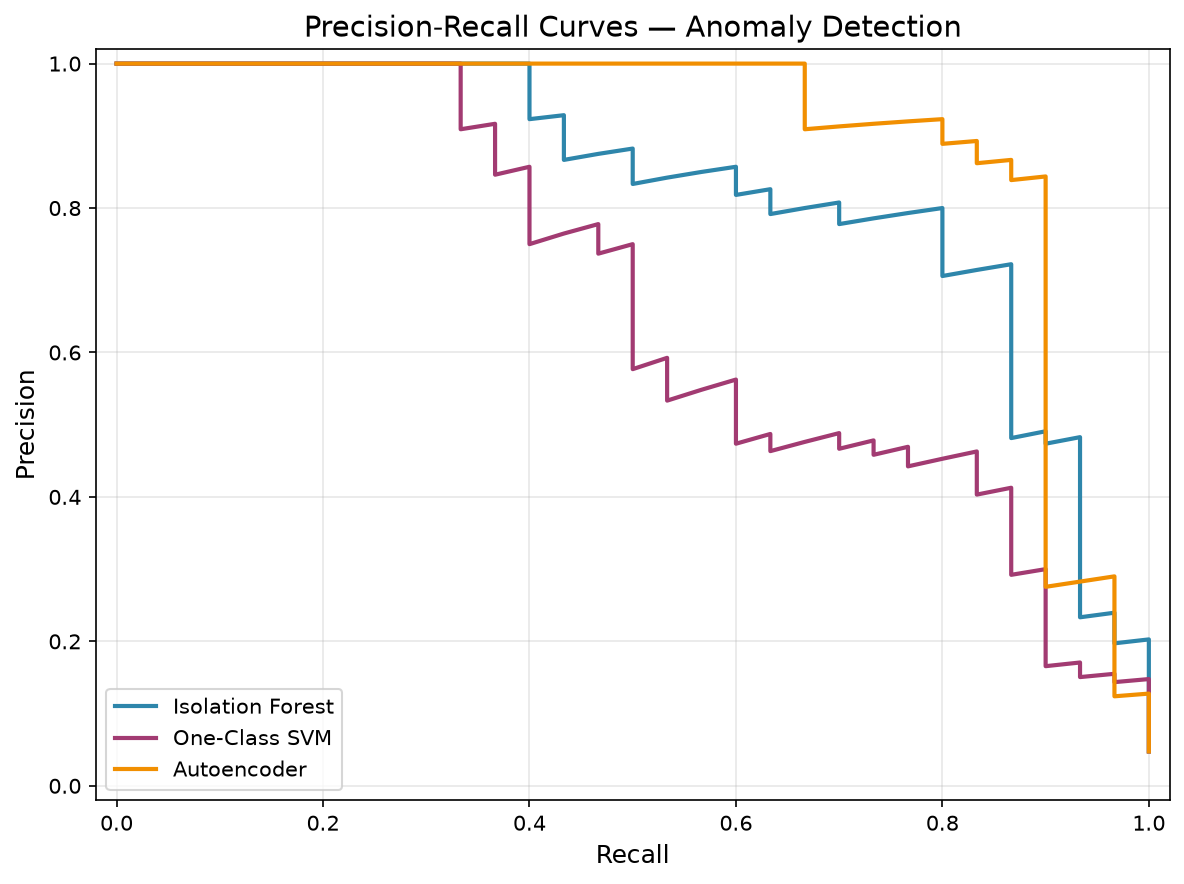
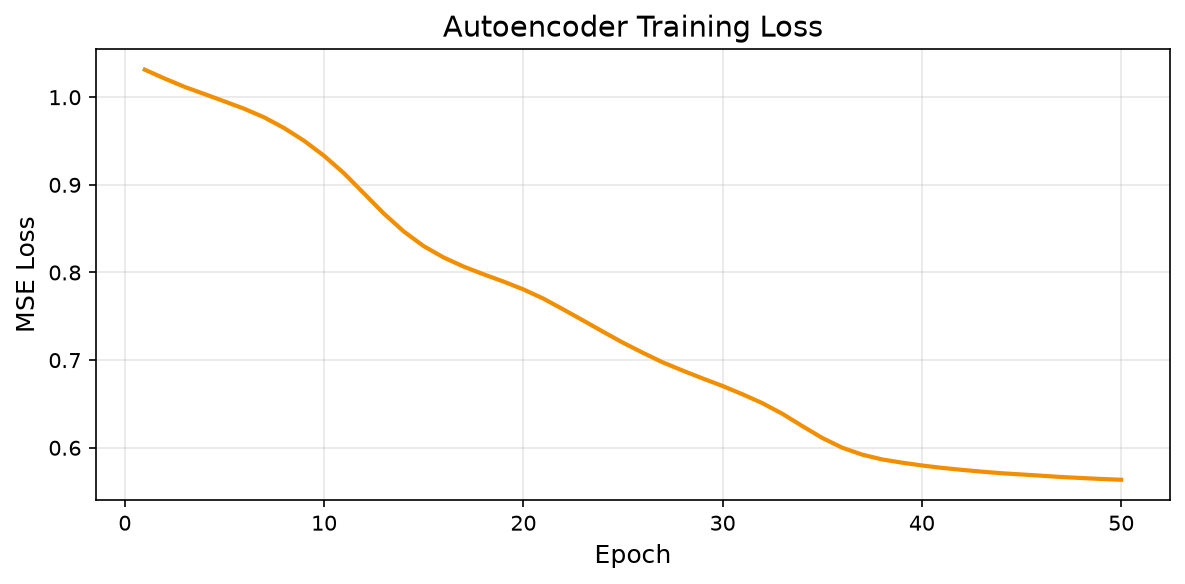
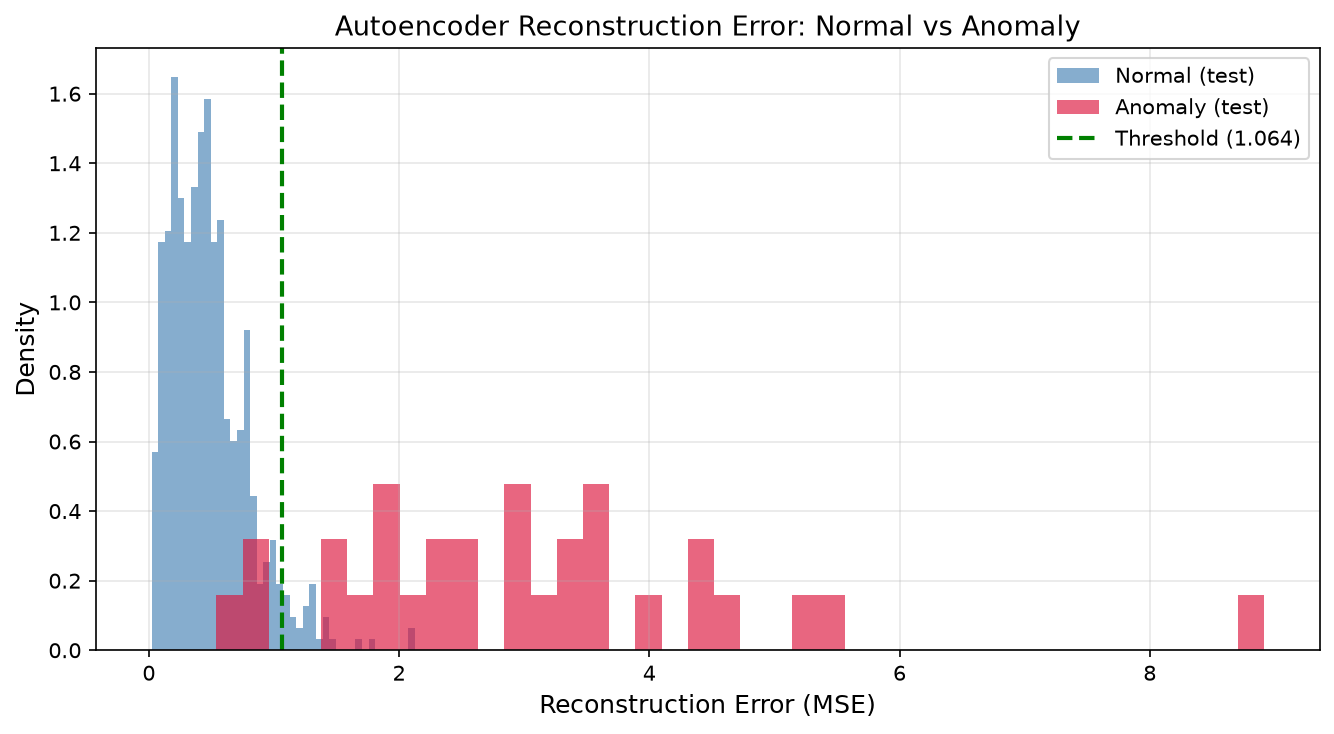
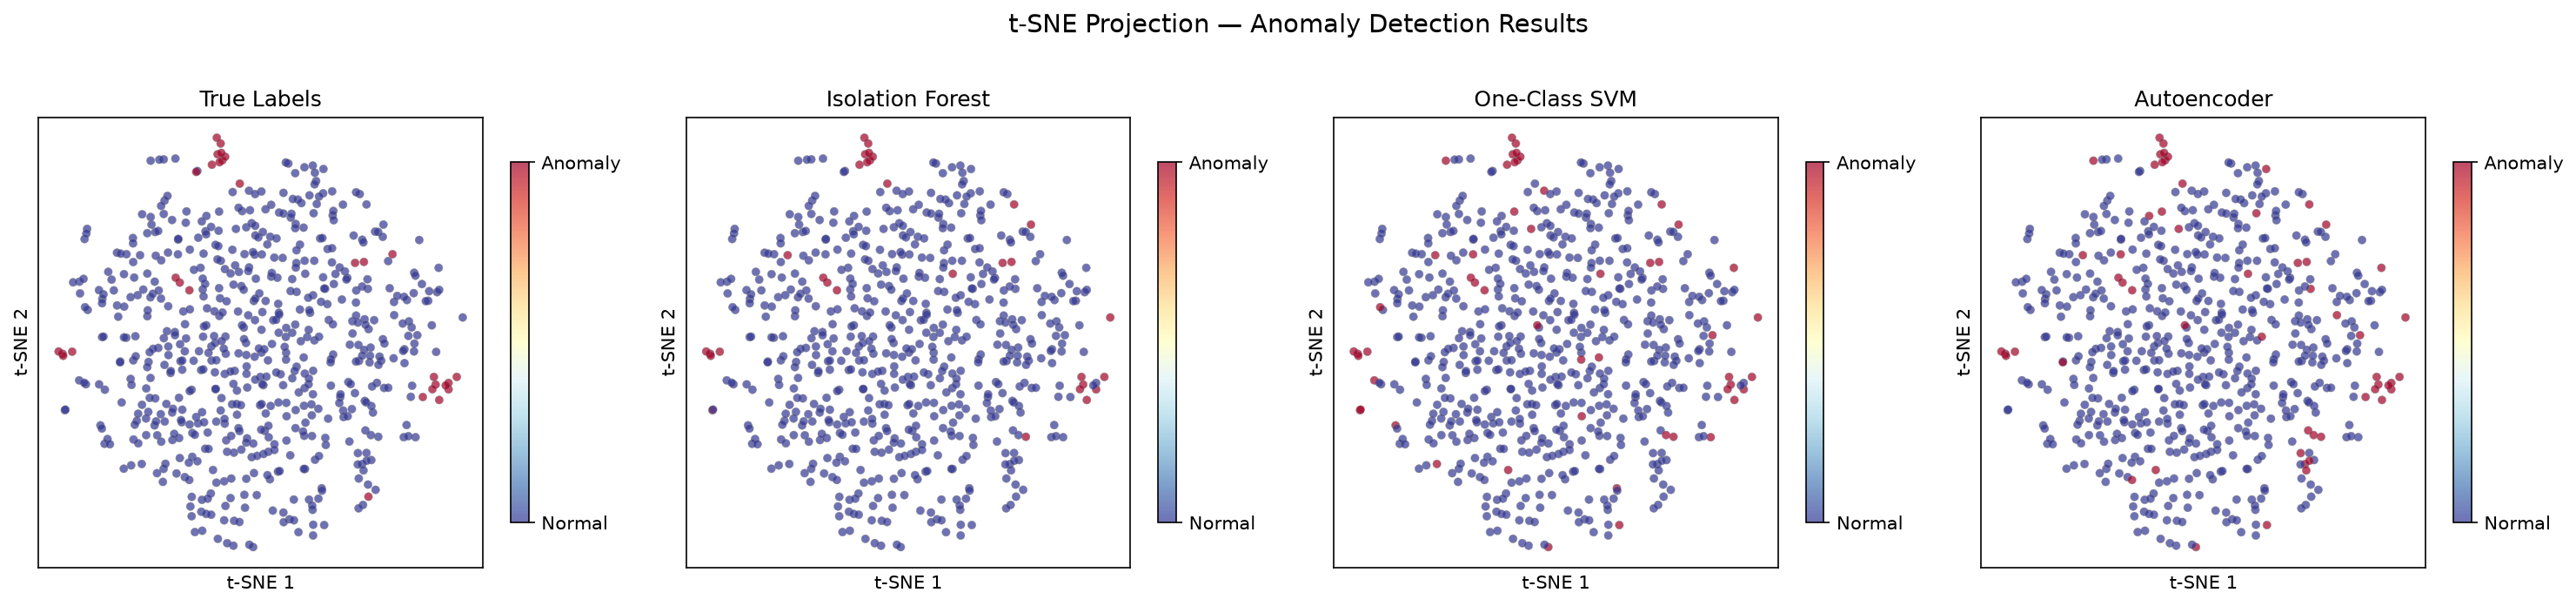
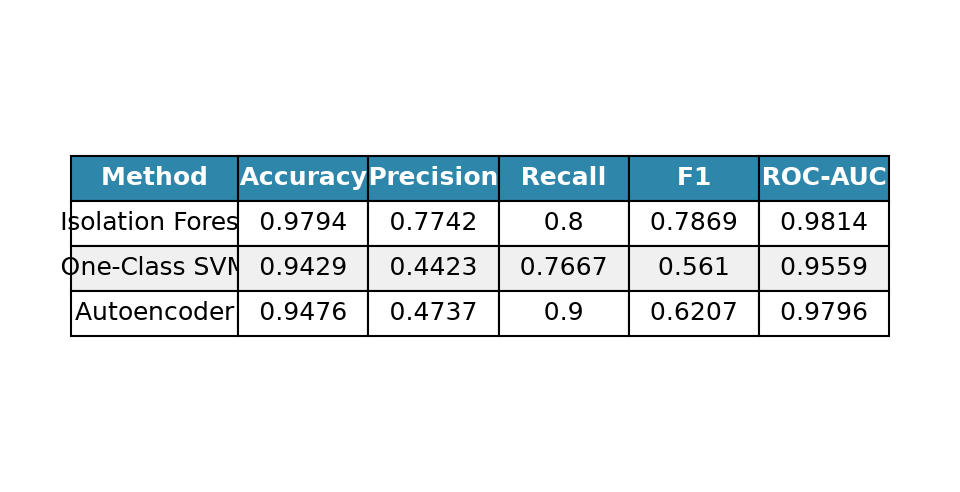
Anomaly detection comparing 3 unsupervised methods on a synthetic dataset of 2,100 samples (2,000 normal + 100 anomalies, 4.8%) with 8 features. Methods: (1) Isolation Forest — 200 isolation trees that isolate outliers in few partitions (Accuracy 0.9794, Precision 0.7742, Recall 0.8000, F1 0.7869, ROC-AUC 0.9814). (2) One-Class SVM — RBF boundary with kernel gamma='scale' and nu=0.05 (Accuracy 0.9429, Precision 0.4423, Recall 0.7667, F1 0.5610, ROC-AUC 0.9559). (3) PyTorch Autoencoder — 8→12→4 (latent)→12→8 network with Tanh activation, 50 epochs, threshold based on P95 of reconstruction MSE (Accuracy 0.9476, Precision 0.4737, Recall 0.9000, F1 0.6207, ROC-AUC 0.9796). Overall winner: Isolation Forest (F1 0.7869, ROC-AUC 0.9814) offers the best precision-recall balance. The Autoencoder catches 90% of anomalies (highest recall) but with more false positives. One-Class SVM, though weaker on this dataset, provides insight into normal data contour understanding. 9 visualizations: feature distributions, confusion matrices, ROC curves, PR curves, AE training loss, reconstruction error histogram, t-SNE projection, and comparison summary table.
# Key features
$ 3 unsupervised anomaly detection methods compared on equal footing
$ Isolation Forest: 200 isolation trees, Accuracy 0.9794, F1 0.7869, ROC-AUC 0.9814
$ PyTorch Autoencoder: 8→4→8 network trained 50 epochs, P95 MSE threshold
$ One-Class SVM: RBF one-class boundary, gamma='scale', nu=0.05
$ Synthetic dataset: 2,100 samples, 8 features, 4.8% known anomalies
$ 9 visualizations: distributions, confusion matrices, ROC, PR, t-SNE, AE error, table
$ Full metrics: Accuracy, Precision, Recall, F1, ROC-AUC for each method
$ Sensitivity-specificity trade-off analysis: AE catches 90% anomalies but more FPs
# Gallery
# Technologies used