user@devops:~$ cat README.md
Causal Inference & Uplift -- treatment effects
# Description
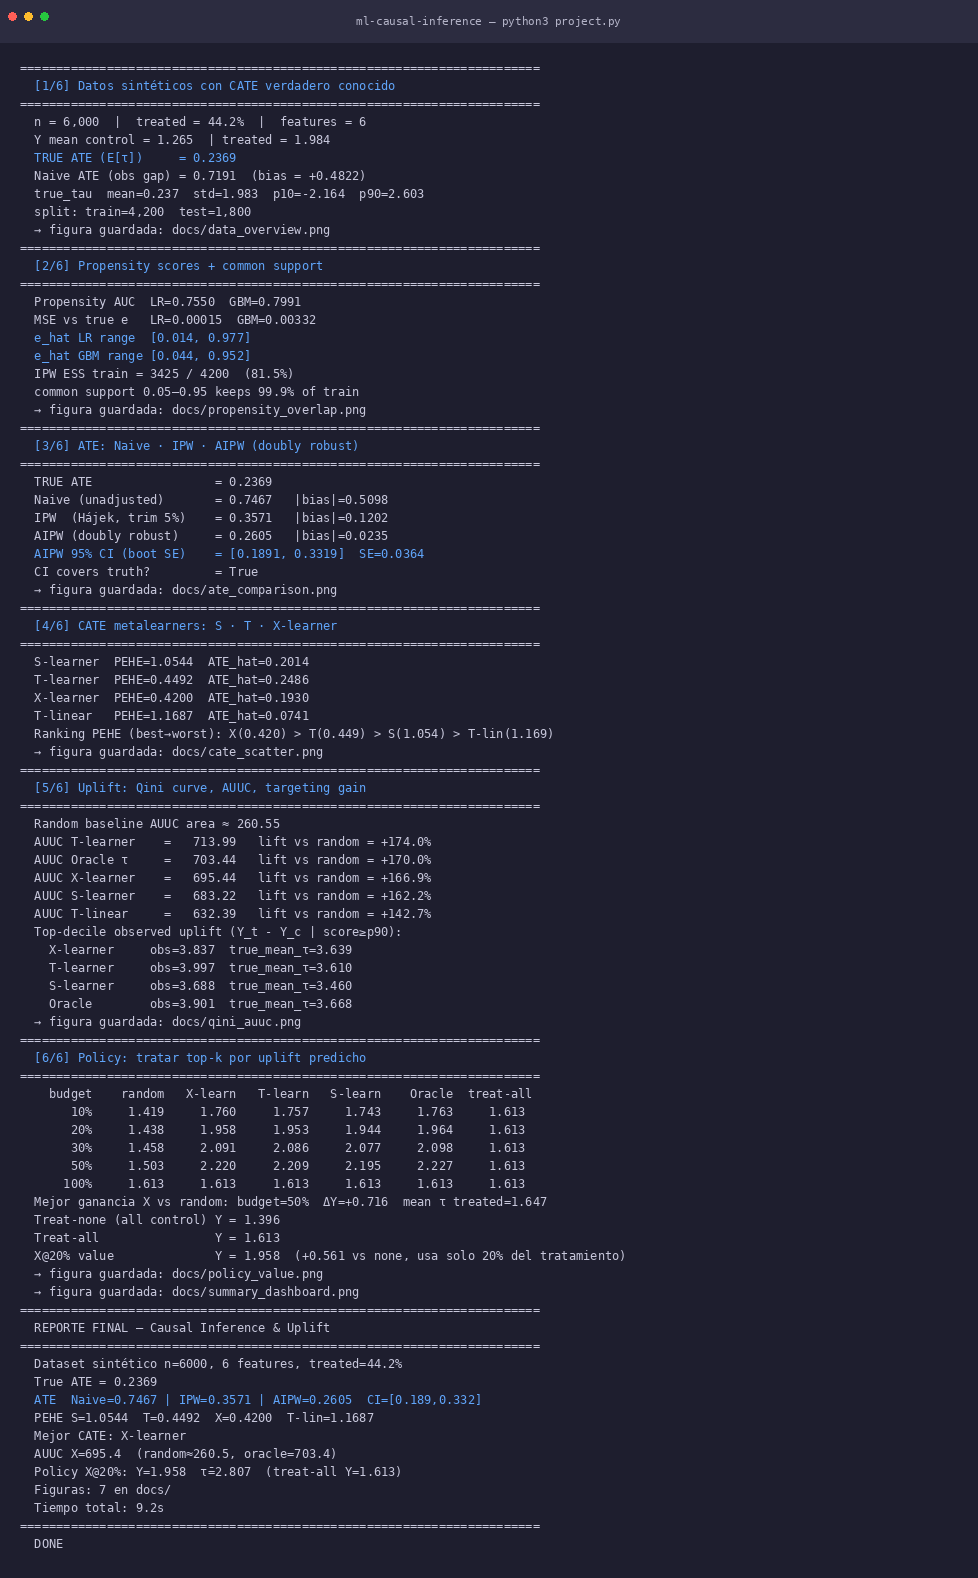
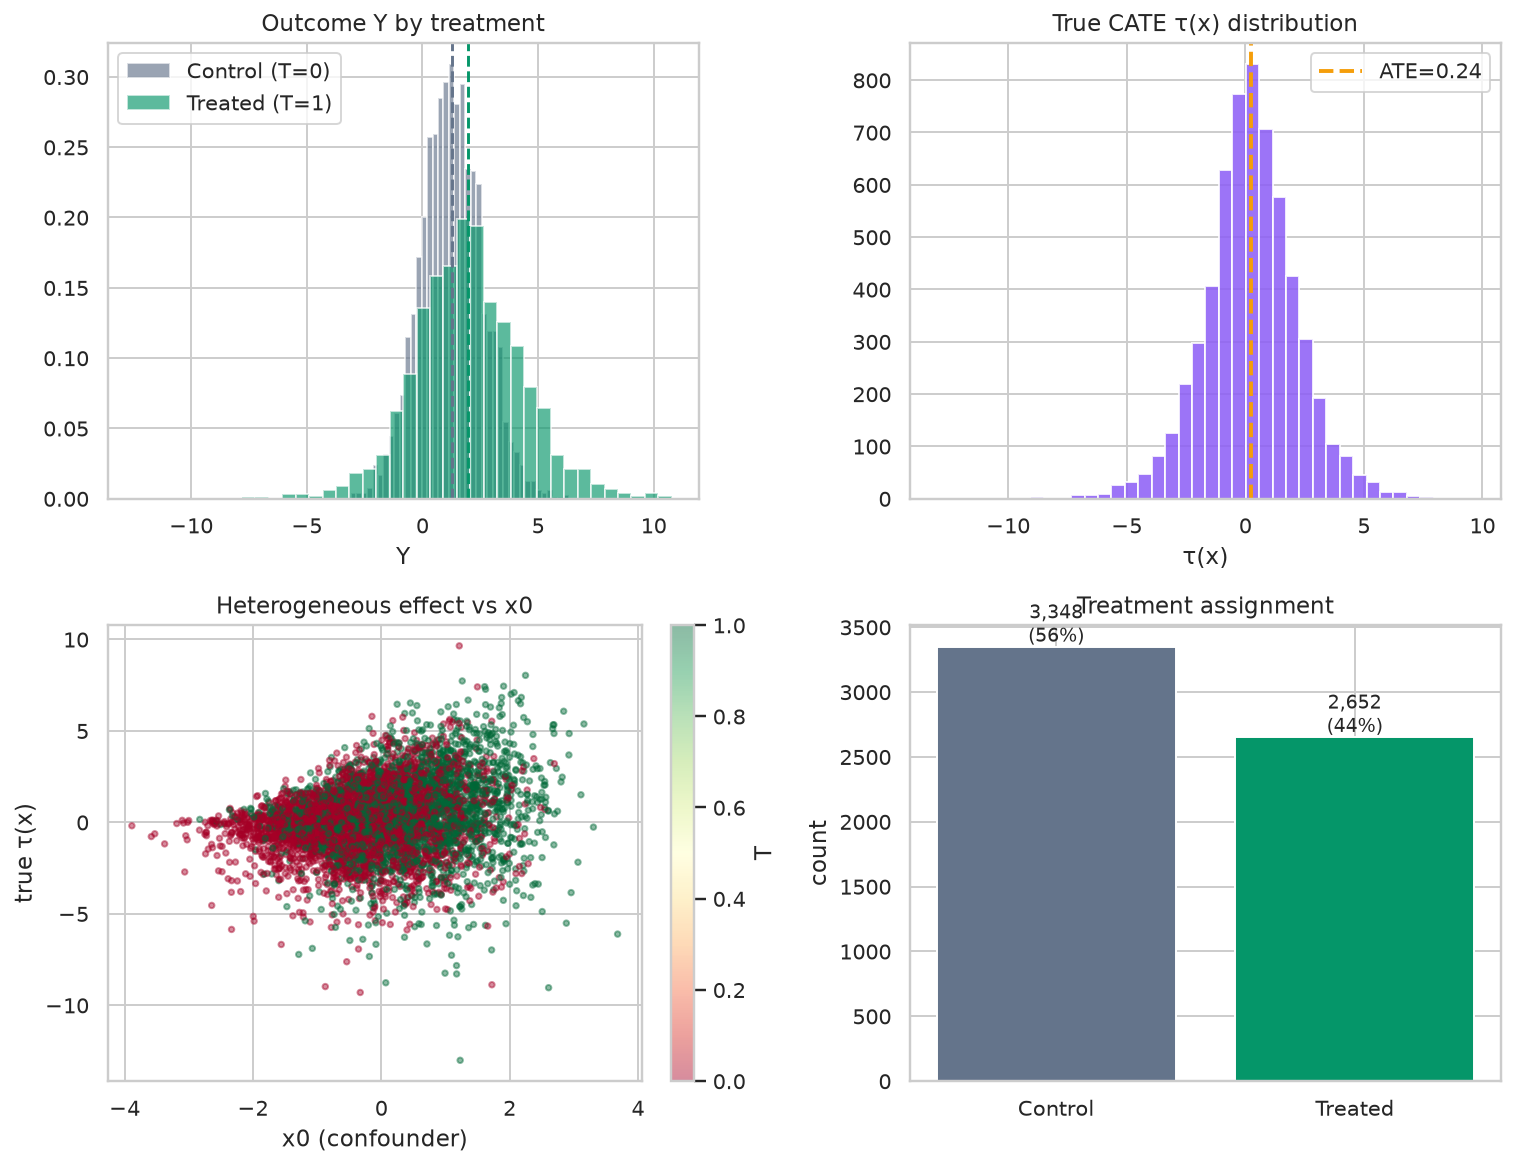
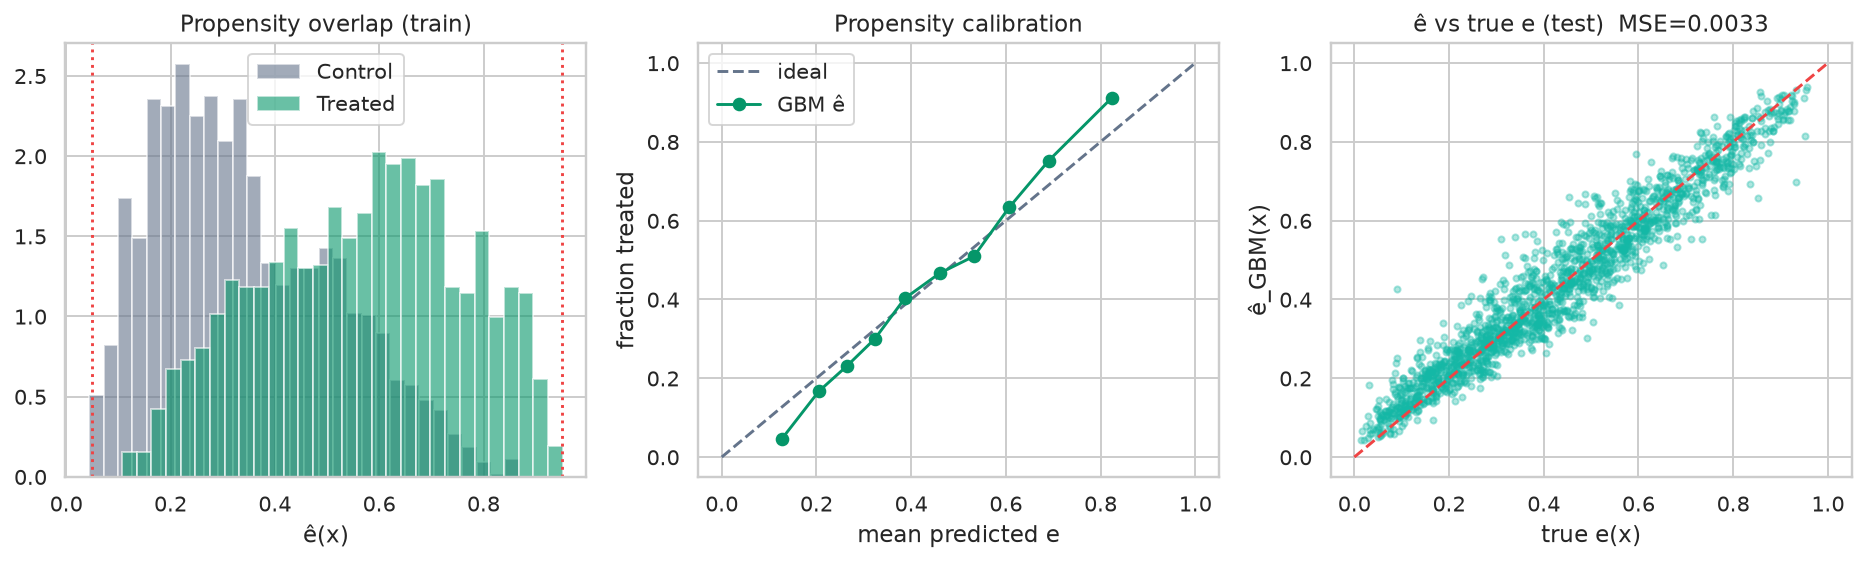
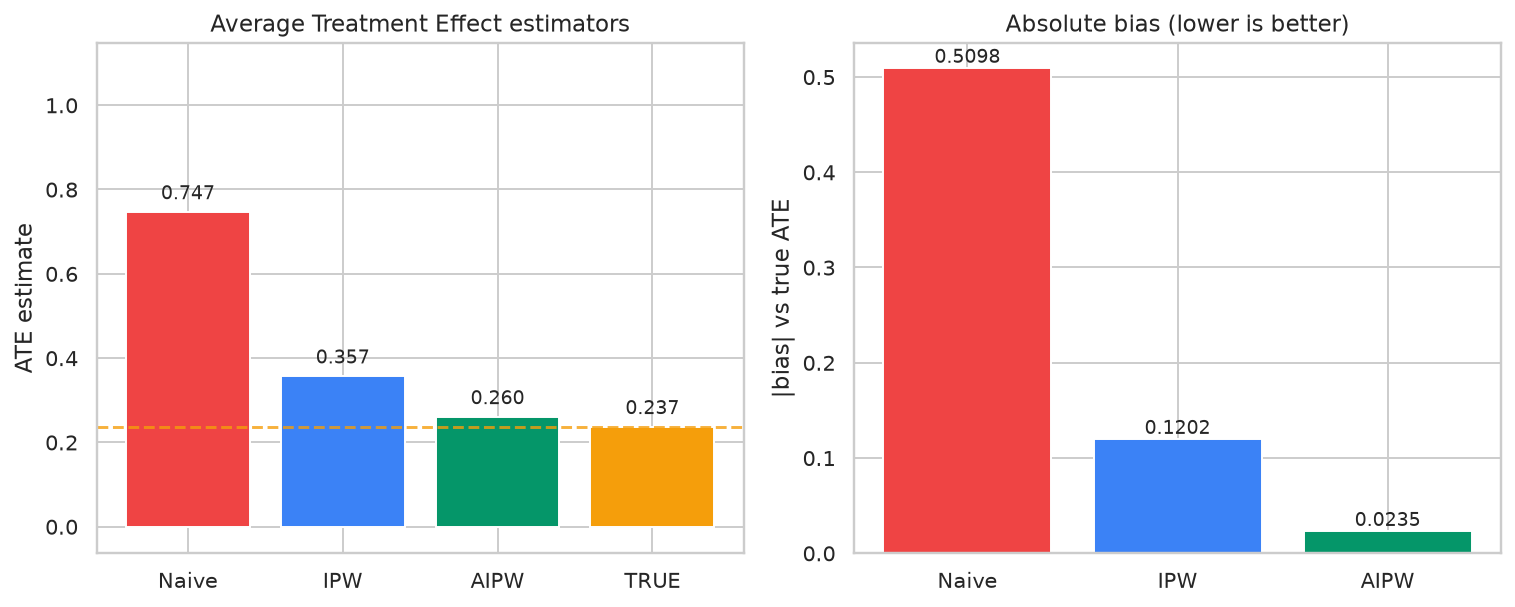
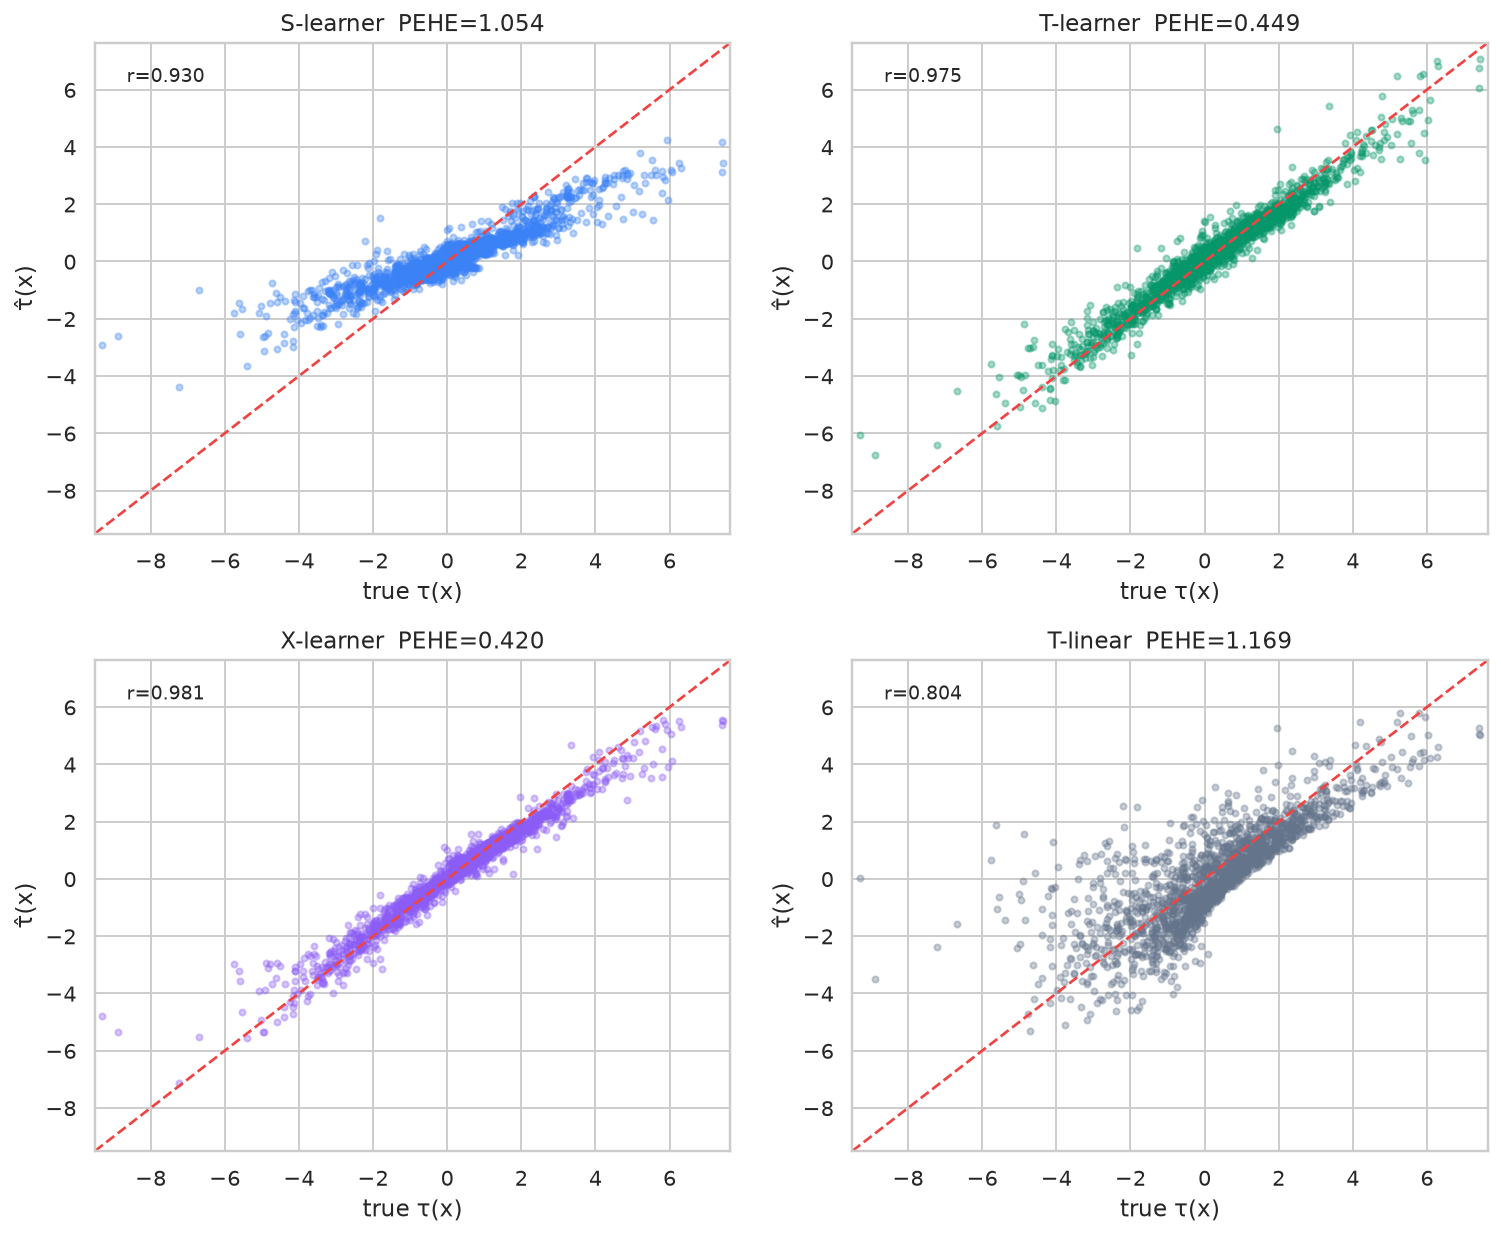
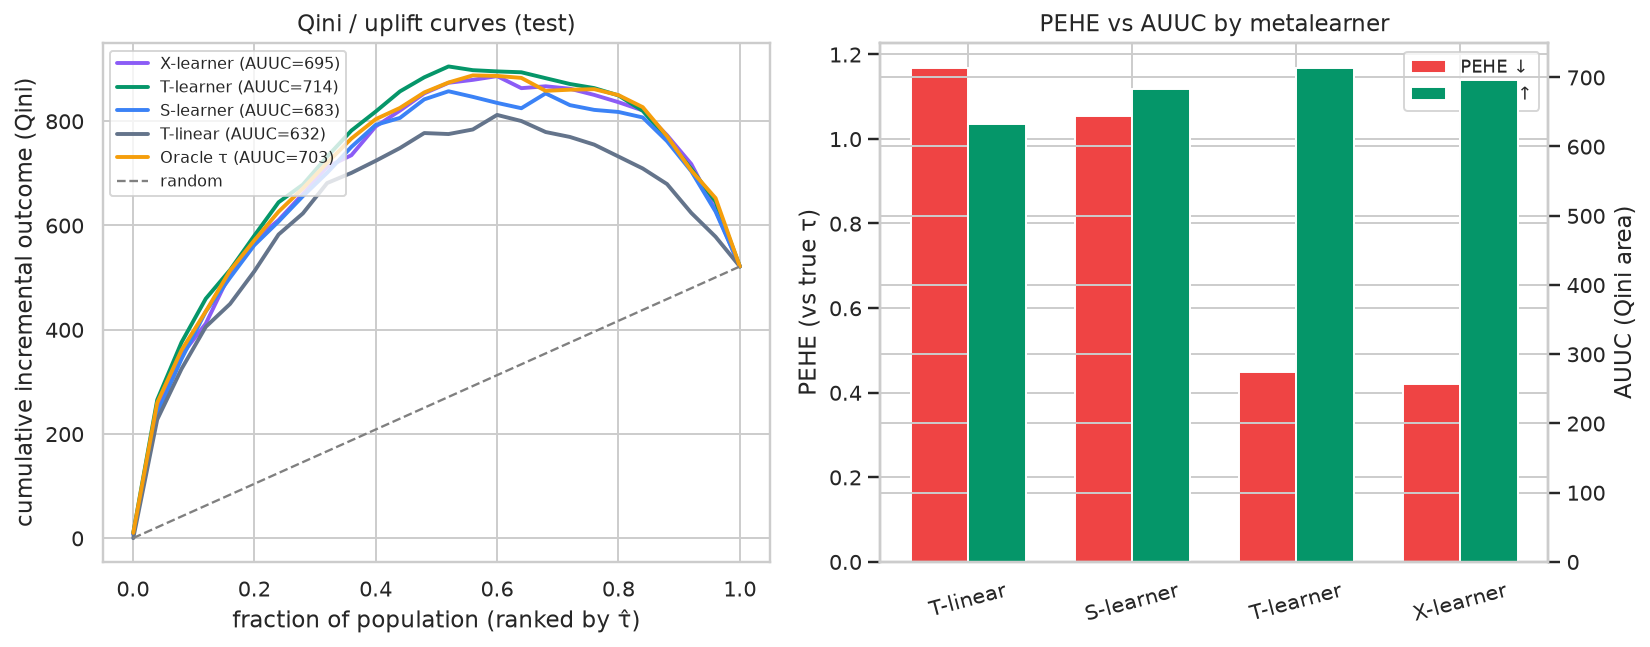
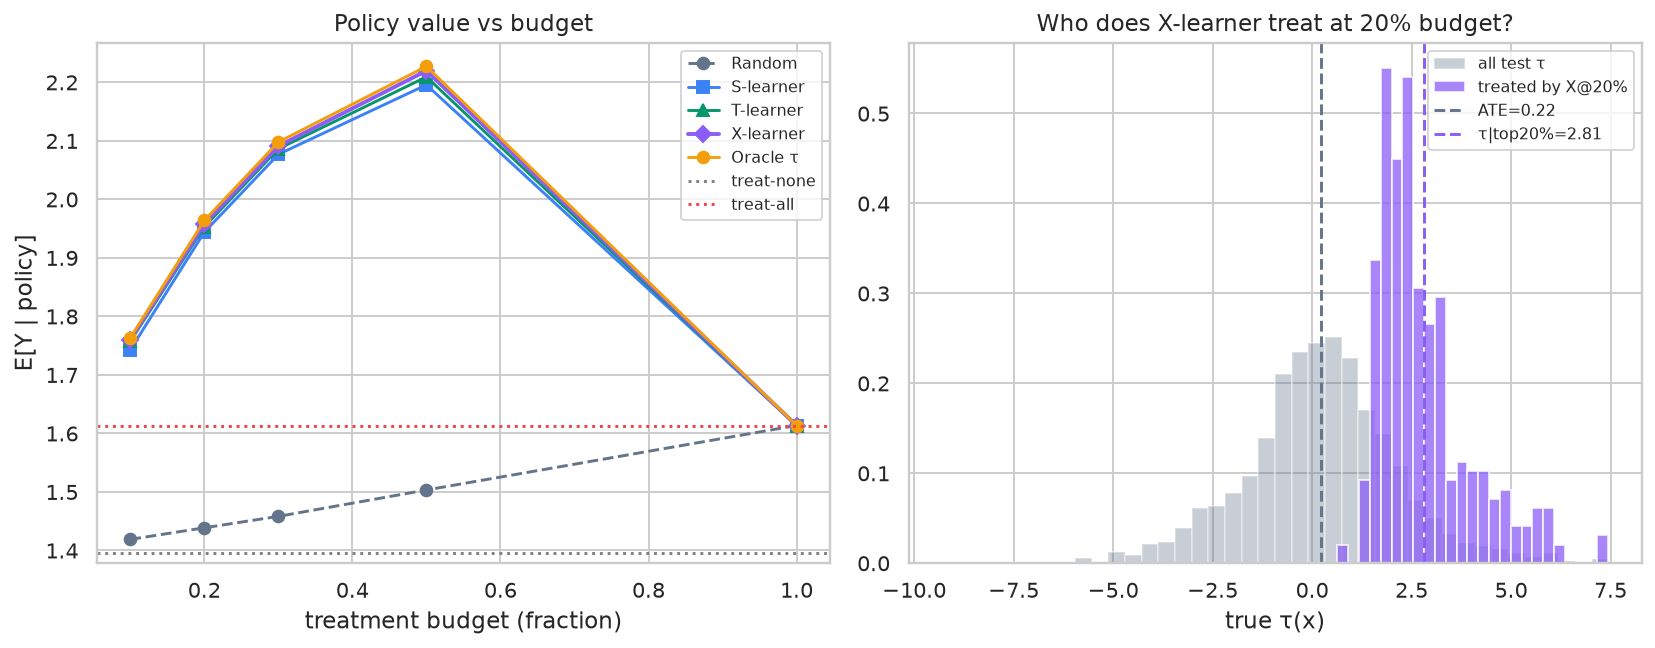
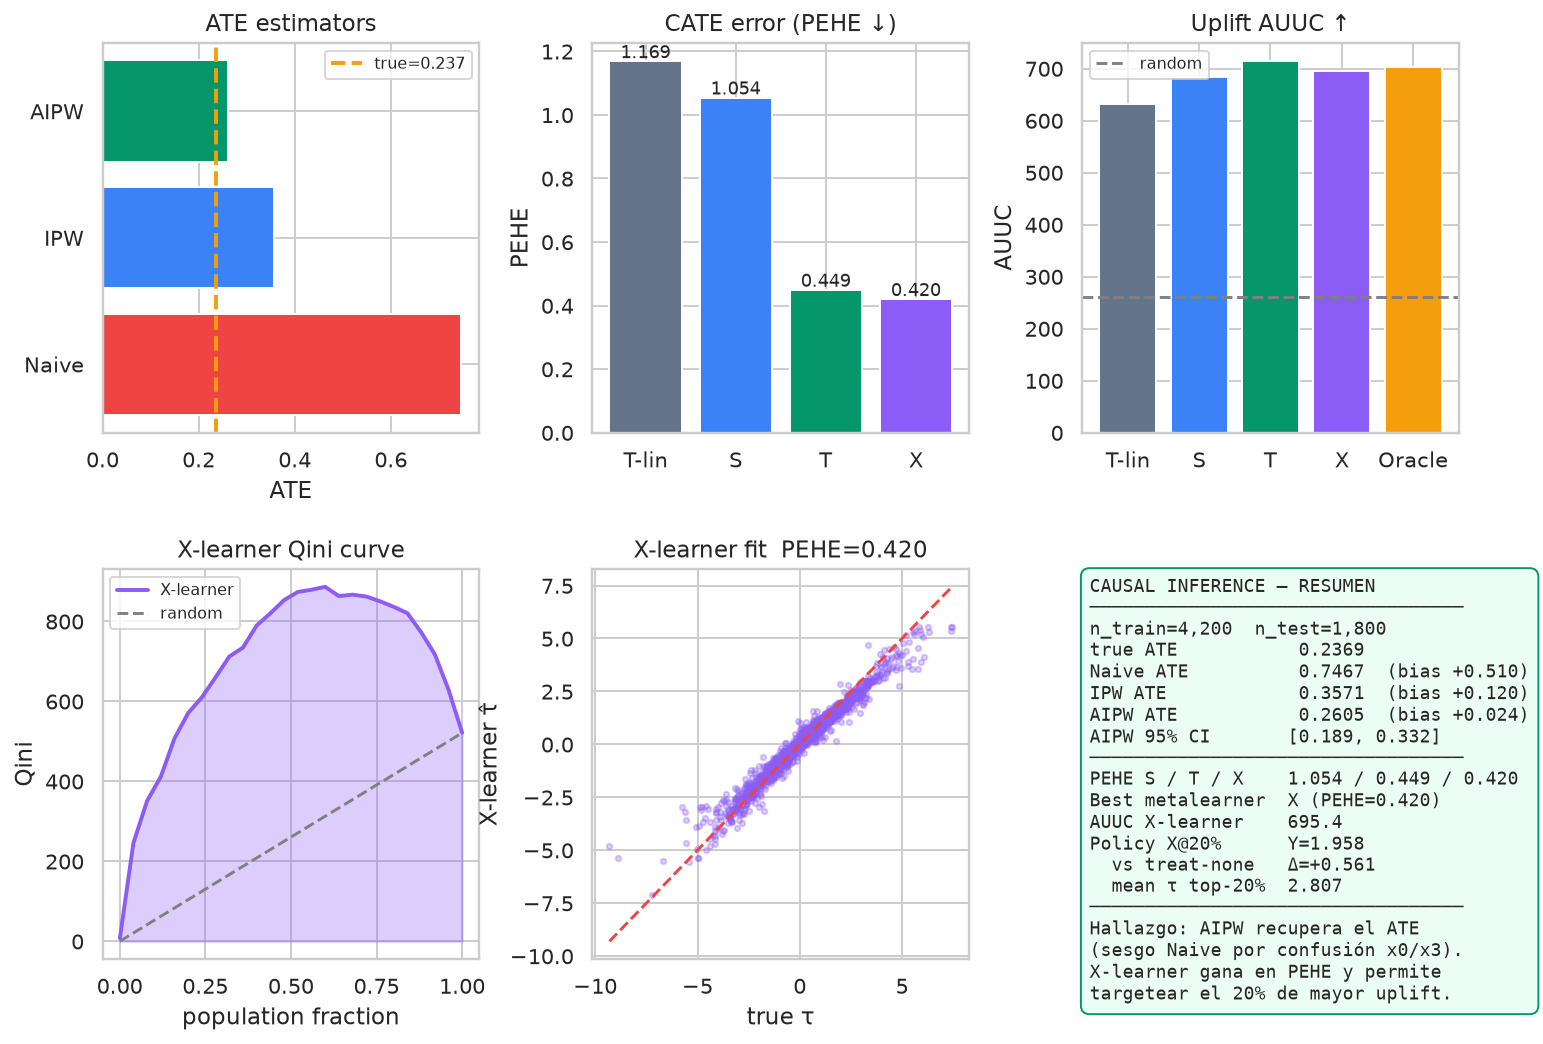
Causal inference and uplift modeling implemented from scratch in Python + scikit-learn (no DoWhy or EconML). Part 1: synthetic data n=6,000 with true CATE tau(x)=2*sigmoid(x0)+1.5*x1-0.8*x2^2+0.5*x0*x1 and propensity driven by confounders x0/x3 (treated 44.2%, train 4,200 / test 1,800). Part 2: propensity LR AUC 0.76 and GBM AUC 0.80, overlap 0.05-0.95 keeps 99.9%, IPW ESS 81.5%. Part 3: Naive ATE 0.747 (bias +0.51 from confounding) vs Hajek IPW 0.357 vs doubly robust AIPW 0.261 (bias +0.02, 95% bootstrap CI [0.19, 0.33] covers truth 0.237). Part 4: CATE metalearners — S-learner PEHE 1.05, T-learner 0.45, X-learner (Kunzel 2019) 0.42, linear baseline 1.17. Part 5: Qini / AUUC curves (X=695 vs random 261, oracle 703); observed top-decile uplift ~3.8. Part 6: treatment policy simulation — X@20% reaches Y=1.96 beating treat-all (1.61) by focusing treatment on the highest-tau quintile. Takeaway: identification (AIPW) fixes observational bias; uplift ranking turns CATE into business value under a limited budget. 7 visualizations.
# Key features
$ Synthetic data with known true CATE and propensity (ground truth for PEHE)
$ Propensity scores LR+GBM, common-support diagnostics, calibration and IPW ESS
$ ATE Naive vs IPW (Hajek, 5% trim) vs doubly robust AIPW with 95% bootstrap CI
$ AIPW recovers ATE 0.261 (truth 0.237); Naive biased to 0.75 via confounders x0/x3
$ S/T/X-learner metalearners (Kunzel et al.): X wins with PEHE 0.42 vs S 1.05
$ Model-free Qini curves and AUUC on test; top-decile uplift ~3.8
$ Budgeted treatment policy: X@20% Y=1.96 > treat-all 1.61
$ 7 visualizations: overview, propensity, ATE, CATE scatter, Qini, policy, dashboard
# Gallery
# Technologies used