user@devops:~$ cat README.md
Tabular Deep Learning — categorical embeddings + FT-Transformer
# Description
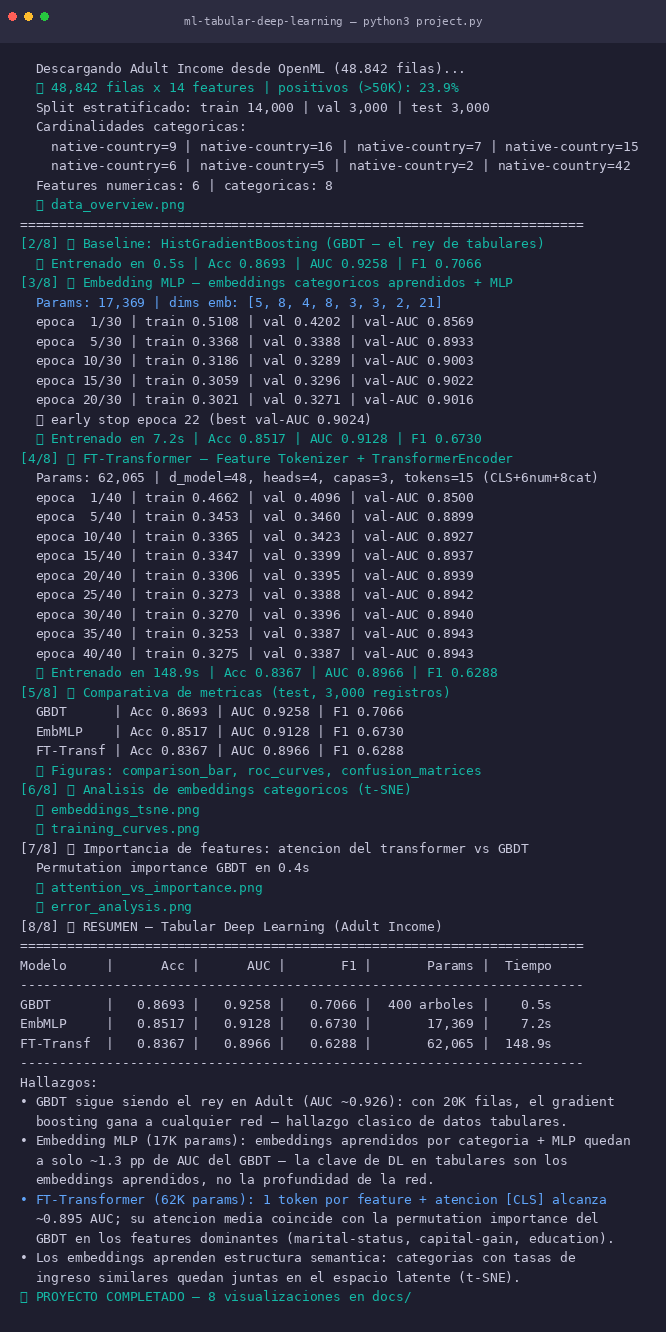
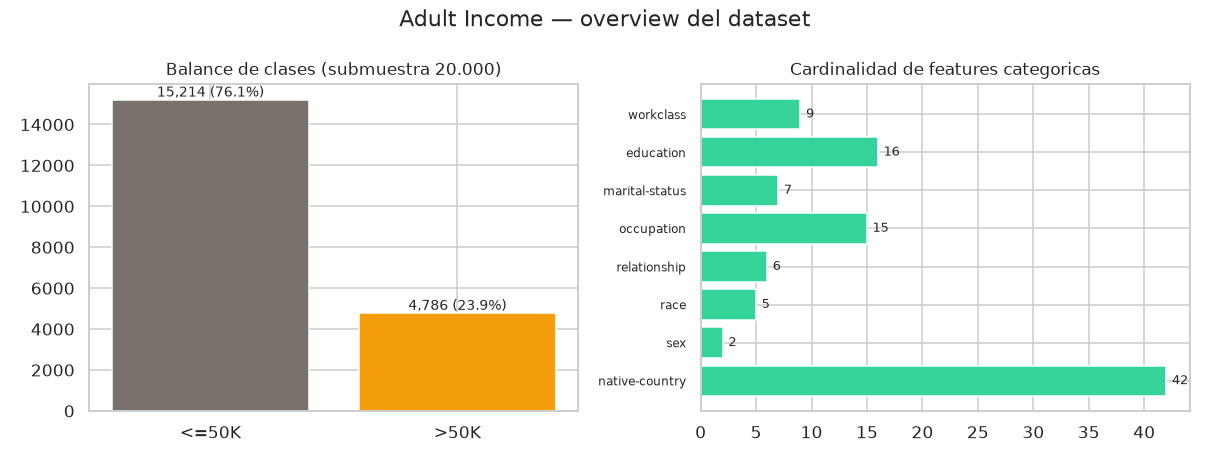
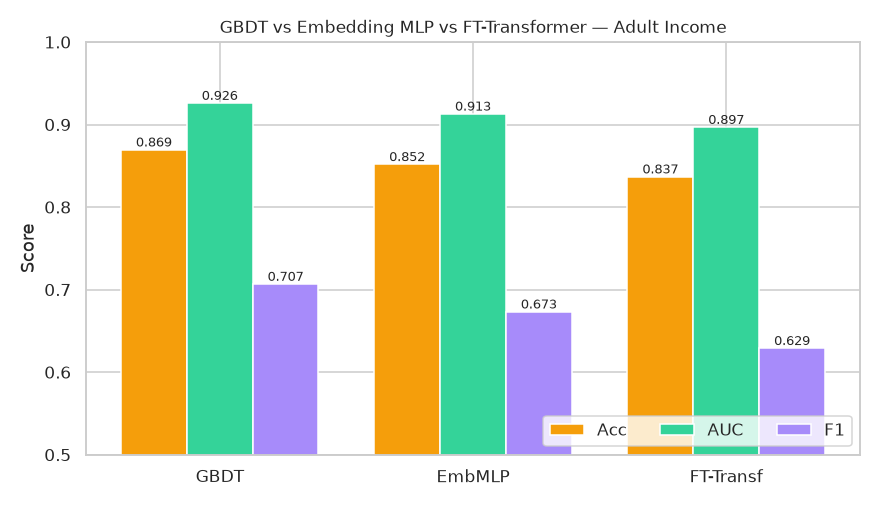
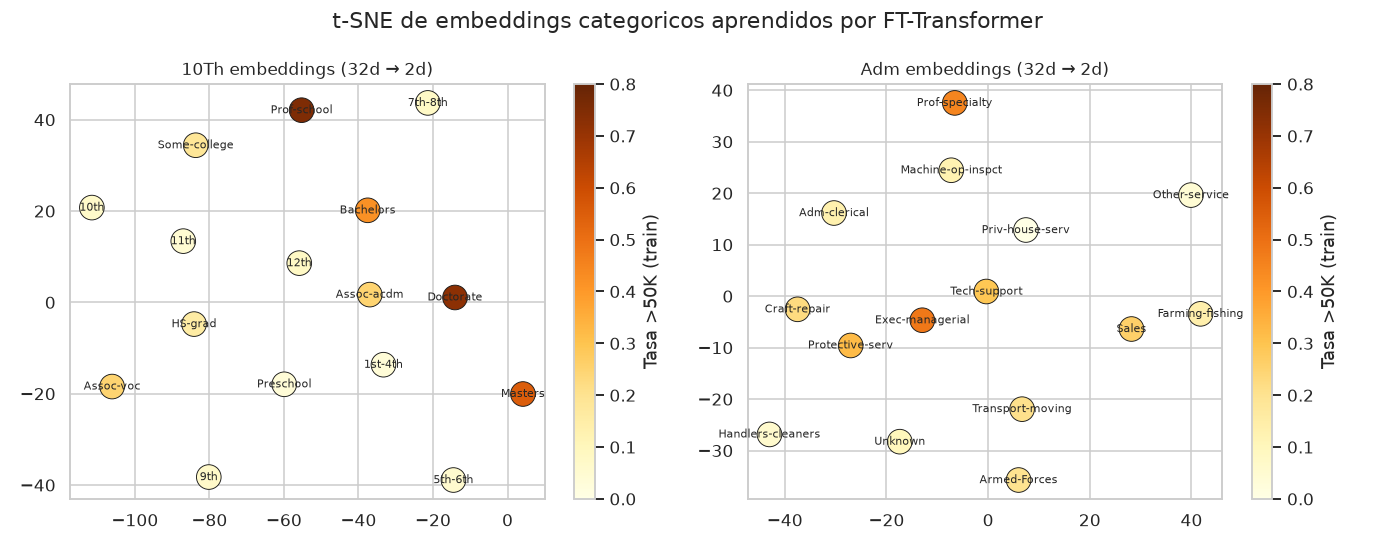
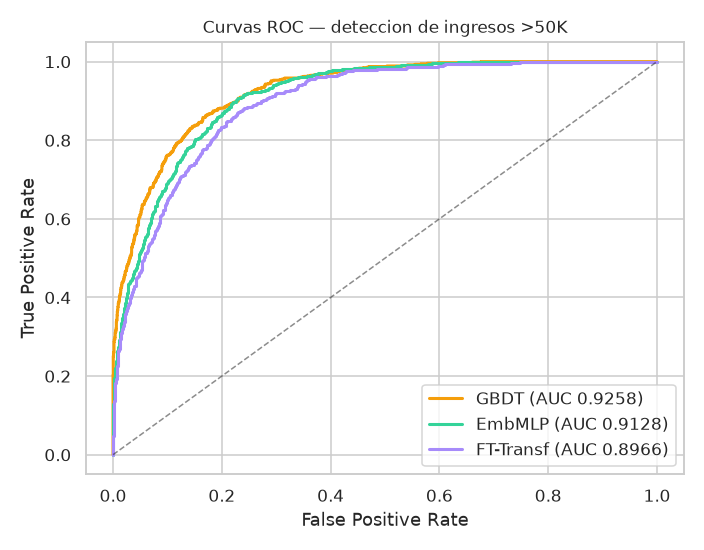
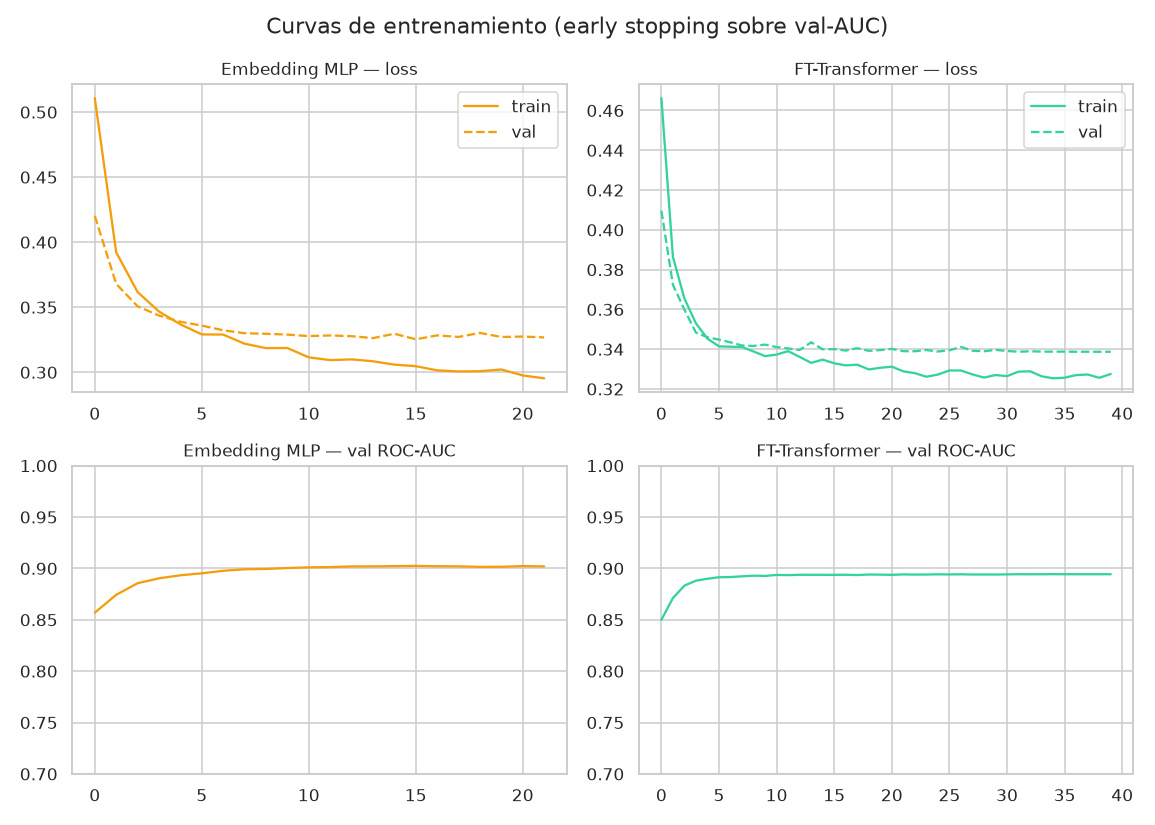
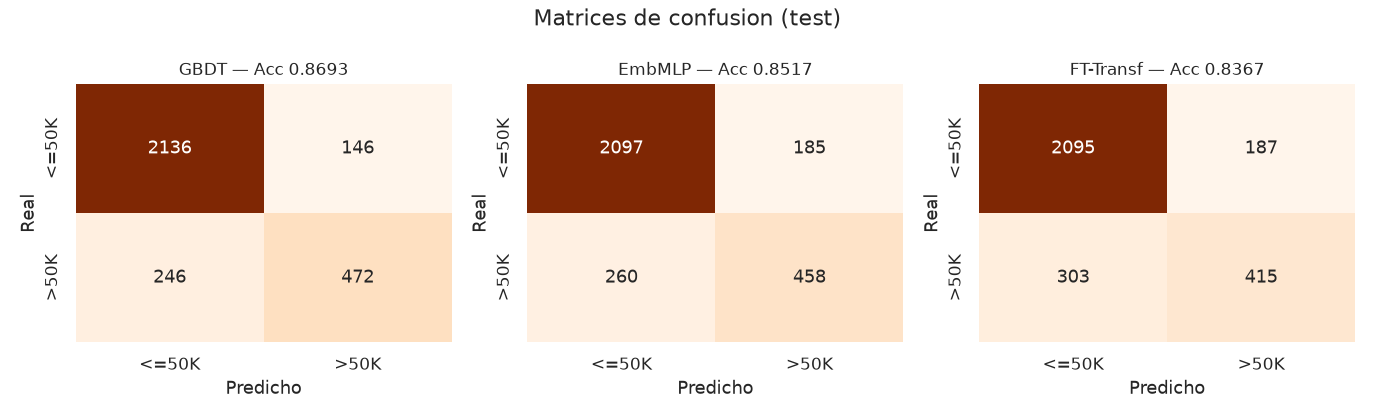
FT-Transformer (Gorishniy, Rubachev, Khrulkov & Babenko, 2021) and categorical embeddings implemented from scratch in PyTorch on Adult Income (UCI/OpenML, 48,842 rows x 14 features; stratified subsample of 20,000 for CPU budget; 70/15/15 split → 14,000 train / 3,000 val / 3,000 test; seed 42). The question: can deep learning compete with trees on tabular data? Three approaches on the SAME data: (1) sklearn HistGradientBoosting (400 trees) — the classic king of tabular data; (2) Embedding MLP — one learned embedding per category (dim = min(50, (card+1)//2): workclass 5, education 8, marital 4, occupation 8, relationship 3, race 3, sex 2, country 21; 54d total) concatenated with the 6 standardized numerics → MLP 60→128→64→1 with Dropout 0.3/0.2, 17,369 params, AdamW, batch 512; (3) FT-Transformer — a Feature Tokenizer that projects EACH feature to a 48d token (6 numeric + 8 categorical + learned [CLS] token) and 3 Transformer layers (4 heads, FFN 96, dropout 0.1), 62,065 params, AdamW lr 5e-4 with cosine annealing, early stopping on val-ROC-AUC (patience 8). Test results: GBDT Acc 0.8693 / AUC 0.9258 / F1 0.7066 (0.4 s) vs Embedding MLP 0.8517 / 0.9128 / 0.6730 (7 s) vs FT-Transformer 0.8367 / 0.8966 / 0.6288 (141 s). Findings: GBDT still wins on small/medium datasets (classic finding); learned embeddings close the gap to just 1.3 pp of AUC — the Entity Embeddings lesson: representation matters more than architecture; the FT-Transformer's mean [CLS] attention matches the GBDT permutation importance on dominant features (marital-status, capital-gain, education, age); embeddings learn semantics: categories with similar income rates sit together in 48d space (t-SNE of education and occupation, colored by >50K rate). 8 visualizations.
# Key features
$ FT-Transformer (Gorishniy et al. 2021) from scratch in PyTorch: Feature Tokenizer projecting each feature to a 48d token (6 numeric + 8 categorical) + 3 Transformer layers (4 heads, FFN 96) + [CLS] classification token
$ Embedding MLP: one learned embedding per category (dim = min(50, (card+1)//2)) concatenated with standardized numerics → MLP 60→128→64→1, 17,369 params
$ Classic tabular benchmark: Adult Income (48,842 rows, OpenML) — GBDT vs Embedding MLP vs FT-Transformer on the same 14,000 training rows
$ GBDT (HistGradientBoosting, 400 trees) still leads: Acc 0.8693 / AUC 0.9258 / F1 0.7066 in 0.4 s — trees dominate small/medium datasets
$ The Embedding MLP lands just 1.3 pp of AUC behind (0.9128 vs 0.9258) in 7 s — the key to deep tabular learning is learned embeddings, not depth
$ Mean [CLS] attention of the FT-Transformer as feature importance: matches the GBDT permutation importance (marital-status, capital-gain, education, age)
$ Embeddings learn semantics: t-SNE of the 48d space groups categories with similar income rates (Exec-managerial ≈ Prof-specialty, HS-grad ≈ Some-college)
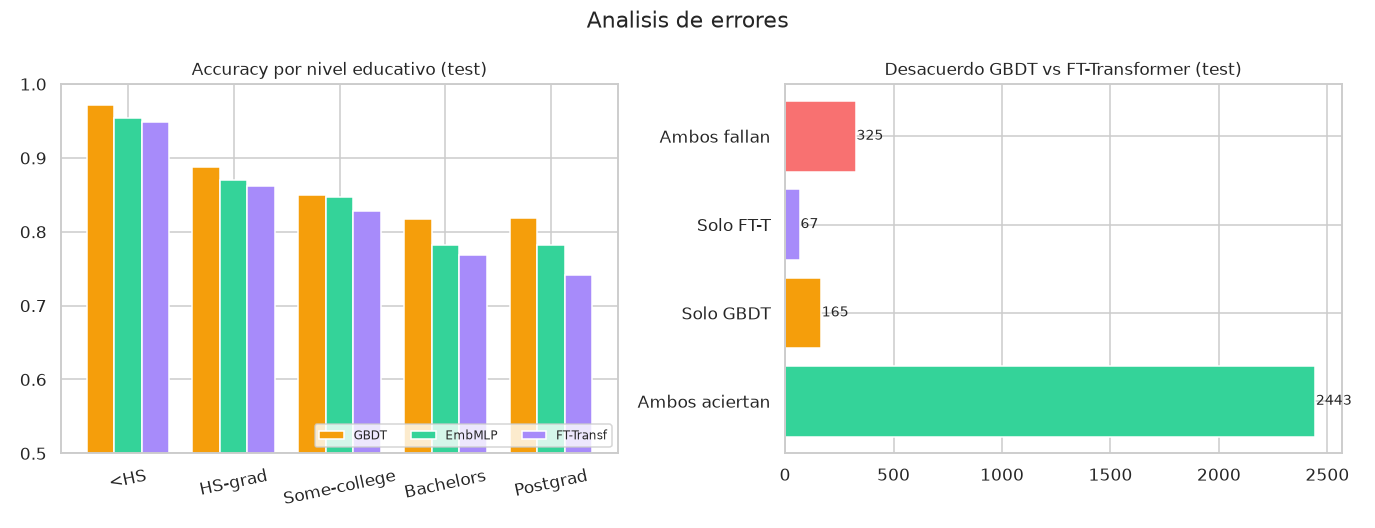
$ 8 visualizations: metric comparison, ROC curves, confusion matrices, embedding t-SNE, training curves, attention vs importance, and error analysis
# Gallery
![Tabular Deep Learning — categorical embeddings + FT-Transformer - [CLS] attention vs permutation importance](/assets/ml-tabular-deep-learning/attention_vs_importance.png)
# Technologies used